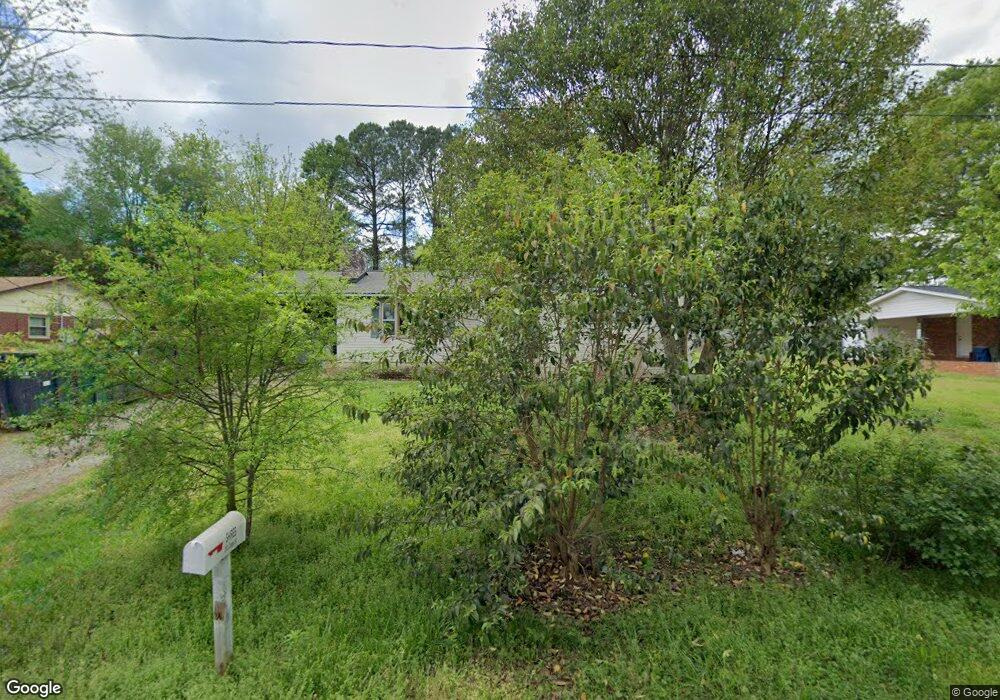
200 Clegg St Mount Holly, NC 28120
Estimated Value: $205,000 - $255,000
3
Beds
1
Bath
1,000
Sq Ft
$235/Sq Ft
Est. Value
About This Home
This home is located at 200 Clegg St, Mount Holly, NC 28120 and is currently estimated at $234,555, approximately $234 per square foot. 200 Clegg St is a home located in Gaston County with nearby schools including Rankin Elementary School, Mount Holly Middle School, and Stuart W. Cramer High School.
Ownership History
Date
Name
Owned For
Owner Type
Purchase Details
Closed on
Apr 9, 2025
Sold by
Fyr Sfr Borrower Llc
Bought by
Home Sfr Borrower Llc
Current Estimated Value
Purchase Details
Closed on
Aug 6, 2018
Sold by
Resi Sfr Sub Llc
Bought by
Fyr Sfr Borrower Llc
Purchase Details
Closed on
Apr 21, 2016
Sold by
Christina Trust
Bought by
Resi Sfr Sub Llc
Purchase Details
Closed on
Jul 25, 2014
Sold by
Franklin Anthony G and Franklin Yolanda M
Bought by
Christiana Trust
Purchase Details
Closed on
Sep 21, 2006
Sold by
Bank Of New York
Bought by
Franklin Anthony G and Franklin Yolanda M
Home Financials for this Owner
Home Financials are based on the most recent Mortgage that was taken out on this home.
Original Mortgage
$54,000
Interest Rate
6.45%
Mortgage Type
Purchase Money Mortgage
Purchase Details
Closed on
Feb 21, 2006
Sold by
Radford William Dillard and Radford Rebecca Mcqueen
Bought by
Bank Of New York and Cwabs Series 2001-01
Create a Home Valuation Report for This Property
The Home Valuation Report is an in-depth analysis detailing your home's value as well as a comparison with similar homes in the area
Home Values in the Area
Average Home Value in this Area
Purchase History
| Date | Buyer | Sale Price | Title Company |
|---|---|---|---|
| Home Sfr Borrower Llc | -- | Selene Title | |
| Home Sfr Borrower Llc | -- | Selene Title | |
| Fyr Sfr Borrower Llc | -- | None Available | |
| Resi Sfr Sub Llc | -- | None Available | |
| Christiana Trust | $91,582 | None Available | |
| Franklin Anthony G | $67,500 | None Available | |
| Bank Of New York | $93,326 | None Available |
Source: Public Records
Mortgage History
| Date | Status | Borrower | Loan Amount |
|---|---|---|---|
| Previous Owner | Franklin Anthony G | $54,000 |
Source: Public Records
Tax History Compared to Growth
Tax History
| Year | Tax Paid | Tax Assessment Tax Assessment Total Assessment is a certain percentage of the fair market value that is determined by local assessors to be the total taxable value of land and additions on the property. | Land | Improvement |
|---|---|---|---|---|
| 2025 | $2,217 | $220,810 | $20,000 | $200,810 |
| 2024 | $2,217 | $220,810 | $20,000 | $200,810 |
| 2023 | $2,241 | $220,810 | $20,000 | $200,810 |
| 2022 | $1,481 | $114,340 | $14,000 | $100,340 |
| 2021 | $1,504 | $114,340 | $14,000 | $100,340 |
| 2019 | $1,515 | $114,340 | $14,000 | $100,340 |
| 2018 | $956 | $68,268 | $13,200 | $55,068 |
| 2017 | $968 | $69,159 | $13,200 | $55,959 |
| 2016 | $602 | $69,159 | $0 | $0 |
| 2014 | $612 | $70,312 | $16,500 | $53,812 |
Source: Public Records
Map
Nearby Homes
- 1015 Hoover Ave
- 1045 Hoover Ave
- 112 Julia St
- 1024 Old Mountain View Rd
- Winslow Plan at Mooreland Oaks
- Huntley Plan at Mooreland Oaks
- Declan Plan at Mooreland Oaks
- Jasper Plan at Mooreland Oaks
- Devin Plan at Mooreland Oaks
- Montcrest Plan at Mooreland Oaks
- Riley Plan at Mooreland Oaks
- Ava Plan at Mooreland Oaks
- TA4000 Plan at Mooreland Oaks
- Kipling Plan at Mooreland Oaks
- Hudson Plan at Mooreland Oaks
- Lenox Plan at Mooreland Oaks
- Bayside Plan at Mooreland Oaks
- Cyprus Plan at Mooreland Oaks
- 5041 Mooreland Oaks Way
- 504 N Hawthorne St
- 202 Clegg St
- 106 N Mcginnis Place
- 104 N Mcginnis Place
- 106 Clegg St
- 105 Clegg St
- 204 Clegg St
- 107 Clegg St
- 107 Clegg St Unit L 6
- 103 N Mcginnis Place
- 103 Clegg St
- 203 Clegg St
- 102 N Mcginnis Place
- 101 N Mcginnis Place
- 208 Clegg St
- 100 Clegg St
- 202 Craig St
- 101 Clegg St
- 207 Clegg St
- 212 Craig St
- 99 N Mcginnis Place