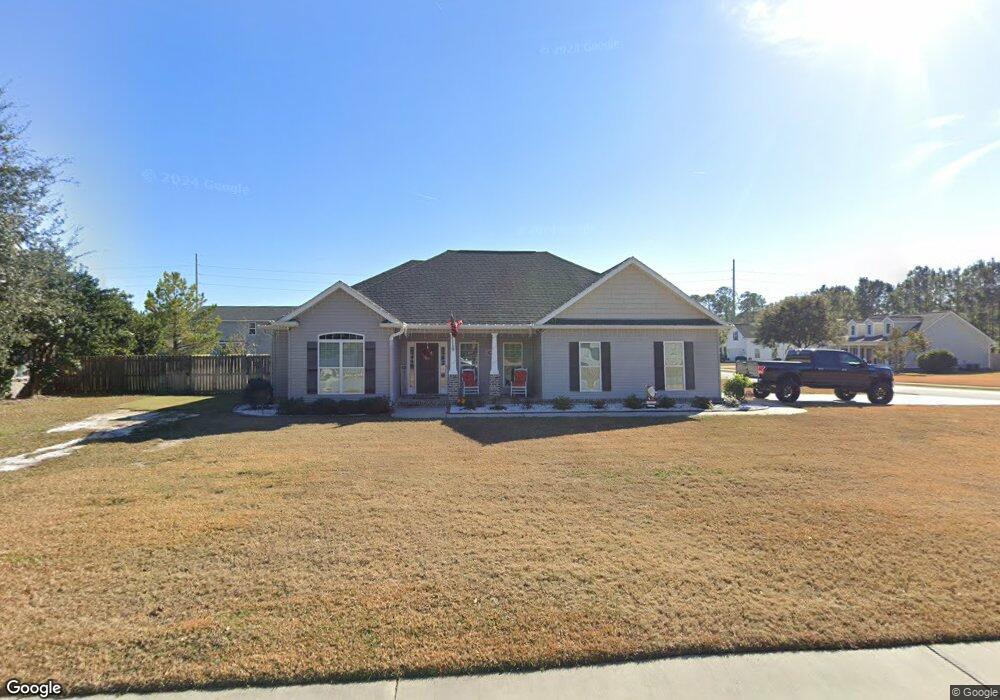
200 Cobbleton Dr Rincon, GA 31326
Estimated Value: $307,000 - $375,000
3
Beds
2
Baths
1,660
Sq Ft
$201/Sq Ft
Est. Value
About This Home
This home is located at 200 Cobbleton Dr, Rincon, GA 31326 and is currently estimated at $334,309, approximately $201 per square foot. 200 Cobbleton Dr is a home located in Effingham County with nearby schools including Ebenezer Elementary School, Ebenezer Middle School, and Effingham County High School.
Ownership History
Date
Name
Owned For
Owner Type
Purchase Details
Closed on
Apr 30, 2015
Sold by
Franklin Construction Llc
Bought by
Cash Rhett M
Current Estimated Value
Home Financials for this Owner
Home Financials are based on the most recent Mortgage that was taken out on this home.
Original Mortgage
$169,767
Outstanding Balance
$130,221
Interest Rate
3.8%
Mortgage Type
FHA
Estimated Equity
$204,088
Purchase Details
Closed on
Jul 9, 2014
Sold by
Bank Of Newington
Bought by
Franklin Construction Llc
Home Financials for this Owner
Home Financials are based on the most recent Mortgage that was taken out on this home.
Original Mortgage
$140,000
Interest Rate
4.26%
Mortgage Type
New Conventional
Purchase Details
Closed on
Jan 29, 2010
Sold by
Coleman Edward A
Bought by
Bank Of Newington
Purchase Details
Closed on
Oct 23, 2006
Bought by
Coleman Edward A
Create a Home Valuation Report for This Property
The Home Valuation Report is an in-depth analysis detailing your home's value as well as a comparison with similar homes in the area
Home Values in the Area
Average Home Value in this Area
Purchase History
| Date | Buyer | Sale Price | Title Company |
|---|---|---|---|
| Cash Rhett M | $172,900 | -- | |
| Franklin Construction Llc | $12,500 | -- | |
| Bank Of Newington | -- | -- | |
| Coleman Edward A | -- | -- |
Source: Public Records
Mortgage History
| Date | Status | Borrower | Loan Amount |
|---|---|---|---|
| Open | Cash Rhett M | $169,767 | |
| Previous Owner | Franklin Construction Llc | $140,000 |
Source: Public Records
Tax History Compared to Growth
Tax History
| Year | Tax Paid | Tax Assessment Tax Assessment Total Assessment is a certain percentage of the fair market value that is determined by local assessors to be the total taxable value of land and additions on the property. | Land | Improvement |
|---|---|---|---|---|
| 2025 | $4,031 | $118,952 | $28,000 | $90,952 |
| 2024 | $4,031 | $105,258 | $28,000 | $77,258 |
| 2023 | $3,010 | $99,092 | $22,800 | $76,292 |
| 2022 | $2,646 | $80,000 | $18,200 | $61,800 |
| 2021 | $2,610 | $78,584 | $16,000 | $62,584 |
| 2020 | $2,500 | $75,589 | $14,400 | $61,189 |
| 2019 | $2,362 | $70,374 | $14,400 | $55,974 |
| 2018 | $2,408 | $70,984 | $14,400 | $56,584 |
| 2017 | $2,283 | $66,189 | $14,400 | $51,789 |
| 2016 | $2,187 | $66,225 | $10,000 | $56,225 |
| 2015 | -- | $61,754 | $10,000 | $51,754 |
| 2014 | -- | $5,600 | $5,600 | $0 |
| 2013 | -- | $10,000 | $10,000 | $0 |
Source: Public Records
Map
Nearby Homes
- 108 Cobbleton Dr
- 110 Cobbleton Dr
- 133 Cobbleton Dr
- 120 Founders Dr
- 115 Founders Dr
- 122 Founders Dr
- 100 Alexander Trail
- The Gwinnett Plan at Ramsey Landing
- The Hatteras Plan at Ramsey Landing
- The Madison Plan at Ramsey Landing
- The Brookhaven Plan at Ramsey Landing
- The Camilla + Bonus Room Plan at Ramsey Landing
- The Stonecrest Plan at Ramsey Landing
- The Grayson Plan at Ramsey Landing
- The Savannah Plan at Ramsey Landing
- The Dalton Plan at Ramsey Landing
- The Roswell Plan at Ramsey Landing
- The Athens + Bonus Bed/Bath Plan at Ramsey Landing
- The Wilmington Plan at Ramsey Landing
- 127 Treutlen Ct
- 200 Cobbleton Dr Unit 68
- 202 Mill Stone Ct
- 301 Branchwood Ct
- 107 Cobbleton Dr Unit 4
- 107 Cobbleton Dr
- 303 Branchwood Ct
- 203 Mill Stone Ct
- 106 Cobbleton Dr
- 105 Cobbleton Dr
- 204 Mill Stone Ct
- 109 Cobbleton Dr
- 205 Mill Stone Ct
- 305 Branchwood Ct
- 103 Cobbleton Dr
- 300 Branchwood Ct
- 207 Mill Stone Ct
- 111 Cobbleton Dr
- 206 Mill Stone Ct
- 101 Cobbleton Dr
- 307 Branchwood Ct