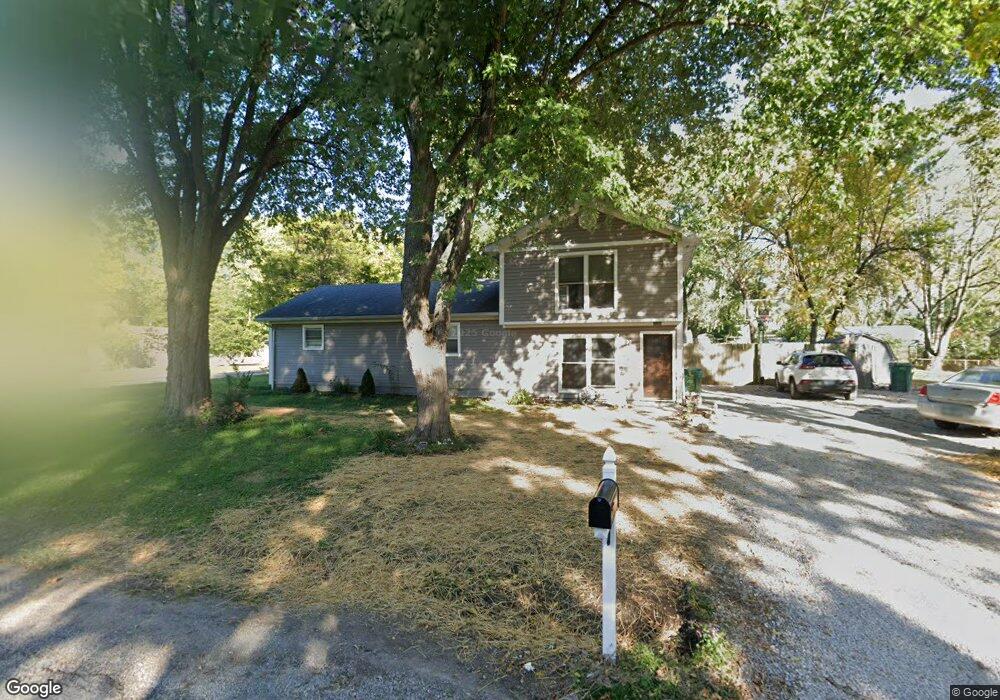
200 Conniston Dr Belleville, IL 62223
Estimated Value: $138,345 - $162,000
3
Beds
2
Baths
1,494
Sq Ft
$101/Sq Ft
Est. Value
About This Home
This home is located at 200 Conniston Dr, Belleville, IL 62223 and is currently estimated at $150,836, approximately $100 per square foot. 200 Conniston Dr is a home located in St. Clair County with nearby schools including Ellis Elementary School, Emge Junior High School, and Our Lady Queen Of Peace Catholic School.
Ownership History
Date
Name
Owned For
Owner Type
Purchase Details
Closed on
Aug 9, 2010
Sold by
Winterbauer Christopher and Winterbauer Brean
Bought by
Geminn Joshua and Geminn Chasity
Current Estimated Value
Home Financials for this Owner
Home Financials are based on the most recent Mortgage that was taken out on this home.
Original Mortgage
$86,830
Outstanding Balance
$59,904
Interest Rate
5.5%
Mortgage Type
FHA
Estimated Equity
$90,932
Purchase Details
Closed on
Apr 16, 2008
Sold by
Mckinney Brean and Winterbauer Brean
Bought by
Winterbauer Christopher
Purchase Details
Closed on
Jun 23, 2007
Sold by
Mckinney Jean and Mckinney James
Bought by
Winterbauer Christopher and Mckinney Brean
Purchase Details
Closed on
Aug 28, 2003
Sold by
Va
Bought by
Mckinney James and Mckinney Jean
Purchase Details
Closed on
Dec 30, 2002
Sold by
Mathis Stanley L
Bought by
Va
Create a Home Valuation Report for This Property
The Home Valuation Report is an in-depth analysis detailing your home's value as well as a comparison with similar homes in the area
Home Values in the Area
Average Home Value in this Area
Purchase History
| Date | Buyer | Sale Price | Title Company |
|---|---|---|---|
| Geminn Joshua | $88,000 | Columbia Title | |
| Winterbauer Christopher | -- | None Available | |
| Winterbauer Christopher | -- | None Available | |
| Mckinney James | -- | Metro East Title Corporation | |
| Va | -- | -- |
Source: Public Records
Mortgage History
| Date | Status | Borrower | Loan Amount |
|---|---|---|---|
| Open | Geminn Joshua | $86,830 |
Source: Public Records
Tax History Compared to Growth
Tax History
| Year | Tax Paid | Tax Assessment Tax Assessment Total Assessment is a certain percentage of the fair market value that is determined by local assessors to be the total taxable value of land and additions on the property. | Land | Improvement |
|---|---|---|---|---|
| 2024 | $2,575 | $36,564 | $4,705 | $31,859 |
| 2023 | $2,355 | $32,808 | $4,222 | $28,586 |
| 2022 | $2,189 | $29,771 | $3,831 | $25,940 |
| 2021 | $2,072 | $27,640 | $3,557 | $24,083 |
| 2020 | $2,091 | $27,015 | $3,388 | $23,627 |
| 2019 | $2,080 | $27,015 | $3,388 | $23,627 |
| 2018 | $1,990 | $25,814 | $3,237 | $22,577 |
| 2017 | $1,846 | $24,041 | $3,015 | $21,026 |
| 2016 | $1,842 | $24,844 | $3,080 | $21,764 |
| 2014 | $1,683 | $24,987 | $3,098 | $21,889 |
| 2013 | $1,702 | $26,658 | $3,305 | $23,353 |
Source: Public Records
Map
Nearby Homes
- 517 Belvedere Dr
- 512 Belvedere Dr
- 400 Conniston Dr
- 636 Fern Dr
- 510 Fern Dr
- 632 Fern Dr
- 109 Cascade Dr
- 29 Cat Tail Ct
- 621 Eiler Rd
- 100 Cascade Dr
- 967 Hidden Cove
- 631 Monica Dr
- 2 Dottie Dr
- 613 Sunnyhill Dr
- 107 Howard Dr
- 109 Eiler Rd
- 8100 Excellence Place
- 8310 Old Saint Louis Rd
- 809 Stone Creek Ln
- 860 Wilshire Dr
- 532 Pembroke Dr
- 537 Belvedere Dr
- 528 Pembroke Dr
- 533 Belvedere Dr
- 201 Conniston Dr
- 201 Conniston Dr
- 537 Pembroke Dr
- 533 Pembroke Dr
- 529 Belvedere Dr
- 529 Pembroke Dr
- 525 Belvedere Dr
- 521 Pembroke Dr
- 520 Pembroke Dr
- 536 Ardmore Dr
- 536 Belvedere Dr
- 532 Ardmore Dr
- 532 Belvedere Dr
- 521 Belvedere Dr
- 600 Ardmore Dr
- 528 Ardmore Dr