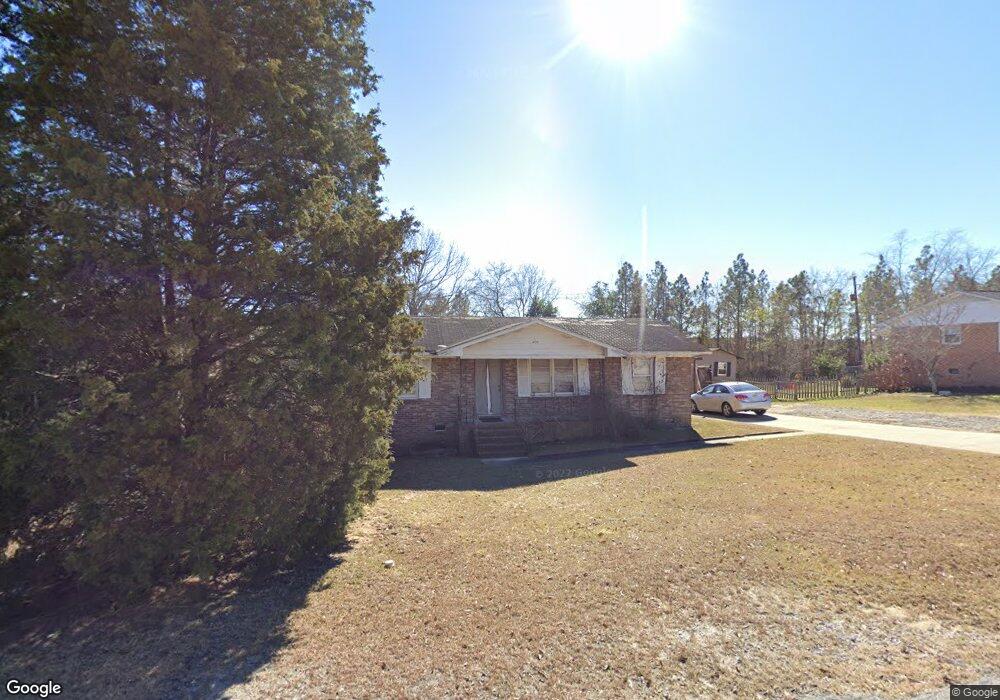
200 Cross Hill Rd Lexington, SC 29073
Estimated Value: $88,000 - $193,000
3
Beds
1
Bath
1,150
Sq Ft
$131/Sq Ft
Est. Value
About This Home
This home is located at 200 Cross Hill Rd, Lexington, SC 29073 and is currently estimated at $151,101, approximately $131 per square foot. 200 Cross Hill Rd is a home located in Lexington County with nearby schools including Red Bank Elementary School, Carolina Springs Middle School, and White Knoll High School.
Ownership History
Date
Name
Owned For
Owner Type
Purchase Details
Closed on
Jun 27, 2025
Sold by
Larimore Properties Llc
Bought by
3 Sons Properties Llc
Current Estimated Value
Home Financials for this Owner
Home Financials are based on the most recent Mortgage that was taken out on this home.
Original Mortgage
$2,363,000
Outstanding Balance
$2,296,559
Interest Rate
6.86%
Mortgage Type
New Conventional
Estimated Equity
-$2,145,458
Purchase Details
Closed on
Aug 26, 2022
Sold by
Larimore Nancy P
Bought by
Larimore Properties Llc
Purchase Details
Closed on
Jul 20, 2022
Sold by
Lee Larimore Sr Harold
Bought by
Larimore Kenney Wilson
Purchase Details
Closed on
Sep 3, 2002
Sold by
Childers Charlie
Bought by
Fore Tammy J
Purchase Details
Closed on
Jul 24, 2002
Sold by
U S Marshal
Bought by
Larimore Harold
Create a Home Valuation Report for This Property
The Home Valuation Report is an in-depth analysis detailing your home's value as well as a comparison with similar homes in the area
Home Values in the Area
Average Home Value in this Area
Purchase History
| Date | Buyer | Sale Price | Title Company |
|---|---|---|---|
| 3 Sons Properties Llc | -- | None Listed On Document | |
| 3 Sons Properties Llc | -- | None Listed On Document | |
| Larimore Properties Llc | -- | Dooley Law Firm Pa | |
| Larimore Kenney Wilson | -- | Mcmillan Claude R | |
| Fore Tammy J | $27,500 | -- | |
| Larimore Harold | $38,000 | -- |
Source: Public Records
Mortgage History
| Date | Status | Borrower | Loan Amount |
|---|---|---|---|
| Open | 3 Sons Properties Llc | $2,363,000 | |
| Closed | 3 Sons Properties Llc | $2,363,000 |
Source: Public Records
Tax History Compared to Growth
Tax History
| Year | Tax Paid | Tax Assessment Tax Assessment Total Assessment is a certain percentage of the fair market value that is determined by local assessors to be the total taxable value of land and additions on the property. | Land | Improvement |
|---|---|---|---|---|
| 2024 | $1,949 | $3,928 | $777 | $3,151 |
| 2023 | $1,949 | $3,928 | $777 | $3,151 |
| 2022 | $1,874 | $3,928 | $777 | $3,151 |
| 2020 | $1,885 | $3,928 | $777 | $3,151 |
| 2019 | $1,696 | $3,416 | $575 | $2,841 |
| 2018 | $1,684 | $3,416 | $575 | $2,841 |
| 2017 | $1,656 | $3,416 | $575 | $2,841 |
| 2016 | $1,604 | $3,414 | $574 | $2,840 |
| 2014 | $1,292 | $2,970 | $780 | $2,190 |
| 2013 | -- | $2,970 | $780 | $2,190 |
Source: Public Records
Map
Nearby Homes
- 216 Cross Hill Rd
- 331 Muddy Springs Rd
- 508 Montrose Dr
- 250 Quin Oak Rd
- 309 Asa Rose Ln
- 138 Druid Rd
- 234 Montrose Dr
- 1726 White Roses Ct
- 1821 Sugarland Ln
- 445 Rainbow Shad Way
- 0 Nazareth Rd
- 469 Rainbow Shad Way
- 461 Rainbow Shad Way
- 457 Rainbow Shad Way
- 407 Rainbow Shad Way
- 472 Rainbow Shad Way
- 440 Rainbow Shad Way
- 436 Rainbow Shad Way
- 432 Rainbow Shad Way
- 1355 Moorgrove Rd
- 204 Cross Hill Rd
- 144 Cross Hill Rd
- 206 Cross Hill Rd
- 208 Cross Hill Rd
- 140 Cross Hill Rd
- 100 David Dr
- 210 Cross Hill Rd
- 101 David Dr
- 212 Cross Hill Rd
- 136 Cross Hill Rd
- 209 Cross Hill Rd
- 214 Cross Hill Rd
- 218 Cross Hill Rd
- 104 David Dr
- 215 Cross Hill Rd
- 133 Cross Hill Rd
- 222 Cross Hill Rd
- 105 David Dr
- 219 Cross Hill Rd
- 132 Cross Hill Rd