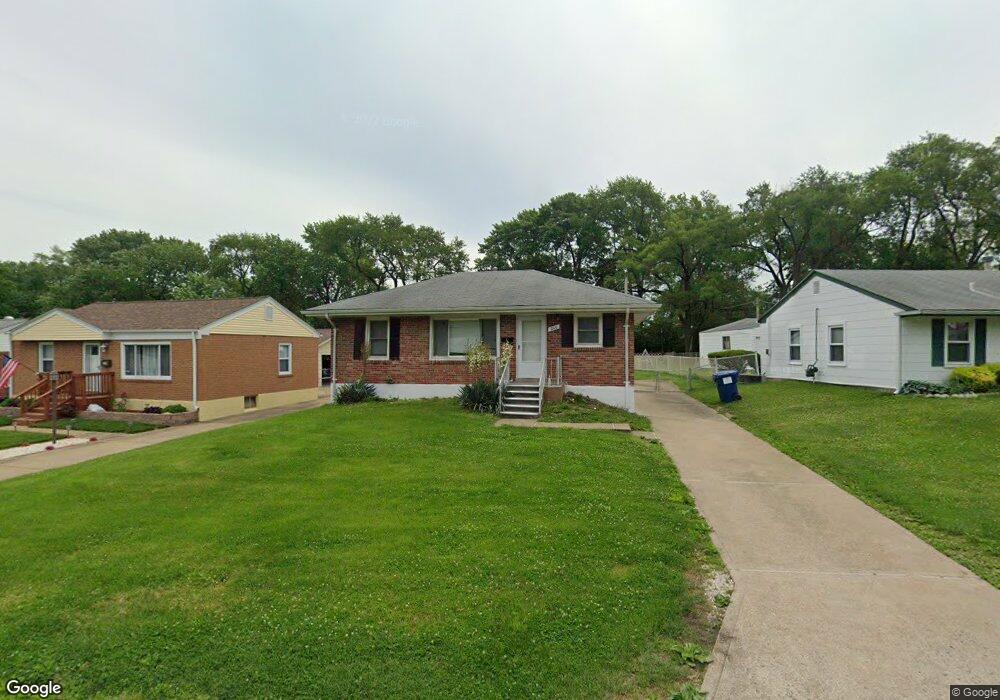
200 de Smet Dr Florissant, MO 63031
Estimated Value: $93,000 - $125,000
2
Beds
1
Bath
816
Sq Ft
$135/Sq Ft
Est. Value
About This Home
This home is located at 200 de Smet Dr, Florissant, MO 63031 and is currently estimated at $109,975, approximately $134 per square foot. 200 de Smet Dr is a home located in St. Louis County with nearby schools including Armstrong Elementary School, West Middle School, and Hazelwood West High School.
Ownership History
Date
Name
Owned For
Owner Type
Purchase Details
Closed on
Apr 2, 2010
Sold by
Federal Home Loan Mortgage Corporation
Bought by
Property Acquisition & Holdings Llc
Current Estimated Value
Purchase Details
Closed on
Feb 10, 2010
Sold by
Lee Corneil A
Bought by
Federal Home Loan Mortgage Corp
Purchase Details
Closed on
Jun 22, 2006
Sold by
Western Properties Inc
Bought by
Lee Corneil A
Purchase Details
Closed on
Apr 6, 2006
Sold by
Goodlow Bradley and Goodlow Sara
Bought by
Western Properties Inc
Purchase Details
Closed on
Jul 29, 2004
Sold by
Wilson Lloyd W and Wilson Frank H
Bought by
Goodlow Bradley and Goodlow Sara
Home Financials for this Owner
Home Financials are based on the most recent Mortgage that was taken out on this home.
Original Mortgage
$74,800
Interest Rate
6.87%
Mortgage Type
Stand Alone First
Create a Home Valuation Report for This Property
The Home Valuation Report is an in-depth analysis detailing your home's value as well as a comparison with similar homes in the area
Home Values in the Area
Average Home Value in this Area
Purchase History
| Date | Buyer | Sale Price | Title Company |
|---|---|---|---|
| Property Acquisition & Holdings Llc | $35,000 | Security Title Co | |
| Federal Home Loan Mortgage Corp | $54,308 | None Available | |
| Lee Corneil A | $80,000 | None Available | |
| Western Properties Inc | $81,763 | None Available | |
| Goodlow Bradley | $93,500 | -- |
Source: Public Records
Mortgage History
| Date | Status | Borrower | Loan Amount |
|---|---|---|---|
| Previous Owner | Goodlow Bradley | $74,800 | |
| Closed | Goodlow Bradley | $18,700 | |
| Closed | Lee Corneil A | -- |
Source: Public Records
Tax History Compared to Growth
Tax History
| Year | Tax Paid | Tax Assessment Tax Assessment Total Assessment is a certain percentage of the fair market value that is determined by local assessors to be the total taxable value of land and additions on the property. | Land | Improvement |
|---|---|---|---|---|
| 2025 | $1,428 | $22,800 | $3,760 | $19,040 |
| 2024 | $1,428 | $15,720 | $2,930 | $12,790 |
| 2023 | $1,426 | $15,720 | $2,930 | $12,790 |
| 2022 | $1,289 | $12,630 | $3,340 | $9,290 |
| 2021 | $1,256 | $12,630 | $3,340 | $9,290 |
| 2020 | $1,024 | $9,710 | $2,130 | $7,580 |
| 2019 | $1,008 | $9,710 | $2,130 | $7,580 |
| 2018 | $936 | $8,270 | $1,430 | $6,840 |
| 2017 | $935 | $8,270 | $1,430 | $6,840 |
| 2016 | $947 | $8,270 | $1,810 | $6,460 |
| 2015 | $1,060 | $9,490 | $1,810 | $7,680 |
| 2014 | $1,333 | $12,370 | $2,260 | $10,110 |
Source: Public Records
Map
Nearby Homes
- 515 Marechal Ln
- 840 Pershall Rd
- 45 Chateau Dr
- 8405 Rena Ct
- 7040 Clover Ln
- 8435 Bridle Spur Dr
- 144 Flora Dr
- 24 Valley Dr
- 1375 S New Florissant Rd
- 7350 N Hanley Rd
- 40 Connolly Dr
- 1815 S New Florissant Rd
- 217 Anistasia Dr
- 135 Anistasia Dr
- 1411 N Florissant Rd
- 230 Anistasia Dr
- 7299 N Hanley Rd Unit B
- 13 Saint Thomas Ct
- 8401 Saint Olaf Dr
- 250 Maple Dr
- 220 de Smet Dr
- 190 de Smet Dr
- 240 de Smet Dr
- 180 de Smet Dr
- 260 de Smet Dr
- 170 de Smet Dr
- 270 de Smet Dr
- 195 Du Bourg Ln
- 160 de Smet Dr
- 205 Du Bourg Ln
- 185 Du Bourg Ln
- 195 de Smet Dr
- 185 de Smet Dr
- 205 de Smet Dr
- 175 Du Bourg Ln
- 235 de Smet Dr
- 215 Du Bourg Ln
- 215 de Smet Dr
- 175 de Smet Dr
- 150 de Smet Dr