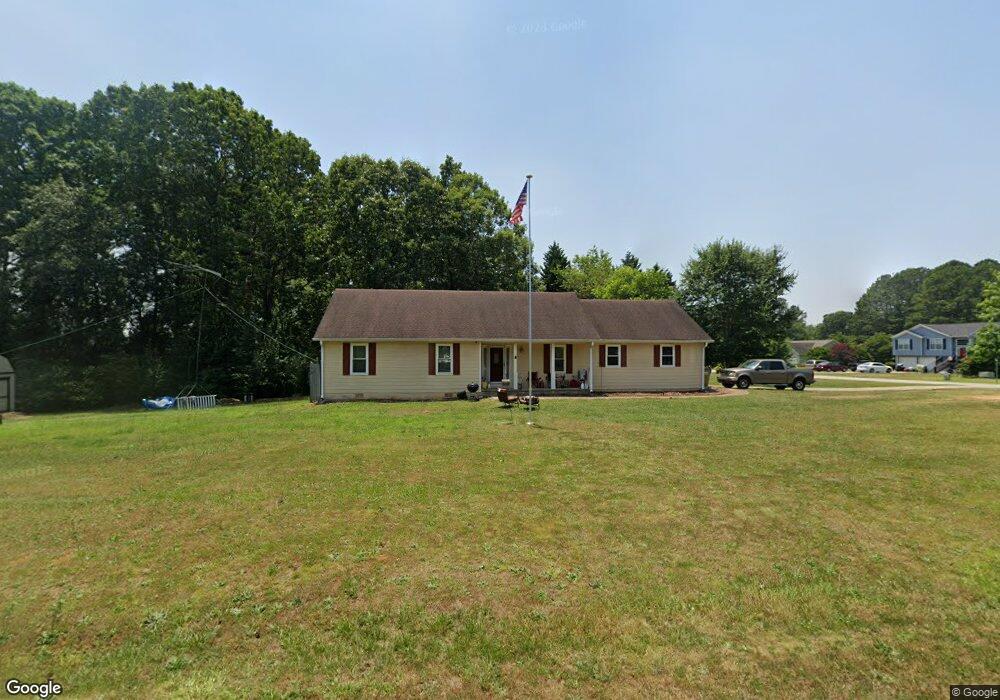
200 Deer Run Dr Winder, GA 30680
Estimated Value: $294,000 - $316,000
3
Beds
2
Baths
2,058
Sq Ft
$149/Sq Ft
Est. Value
About This Home
This home is located at 200 Deer Run Dr, Winder, GA 30680 and is currently estimated at $307,271, approximately $149 per square foot. 200 Deer Run Dr is a home located in Barrow County with nearby schools including Kennedy Elementary School, Westside Middle School, and Apalachee High School.
Ownership History
Date
Name
Owned For
Owner Type
Purchase Details
Closed on
May 26, 2000
Sold by
Pirkle Kevin L and Pirkle Rachael E
Bought by
Fenley Mark D
Current Estimated Value
Home Financials for this Owner
Home Financials are based on the most recent Mortgage that was taken out on this home.
Original Mortgage
$98,940
Outstanding Balance
$34,681
Interest Rate
8.14%
Mortgage Type
VA
Estimated Equity
$272,590
Purchase Details
Closed on
Jun 10, 1998
Sold by
Wilbanks Mickey L and Wilbanks Holly M
Bought by
Purkle Kevin L and Purkle Rachel E
Home Financials for this Owner
Home Financials are based on the most recent Mortgage that was taken out on this home.
Original Mortgage
$83,800
Interest Rate
7.21%
Mortgage Type
New Conventional
Purchase Details
Closed on
Jul 22, 1994
Sold by
Ham Constr Devel
Bought by
Wilbanks Mickey Holly
Home Financials for this Owner
Home Financials are based on the most recent Mortgage that was taken out on this home.
Original Mortgage
$75,900
Interest Rate
8.26%
Create a Home Valuation Report for This Property
The Home Valuation Report is an in-depth analysis detailing your home's value as well as a comparison with similar homes in the area
Home Values in the Area
Average Home Value in this Area
Purchase History
| Date | Buyer | Sale Price | Title Company |
|---|---|---|---|
| Fenley Mark D | $97,000 | -- | |
| Purkle Kevin L | $88,300 | -- | |
| Wilbanks Mickey Holly | $79,900 | -- |
Source: Public Records
Mortgage History
| Date | Status | Borrower | Loan Amount |
|---|---|---|---|
| Open | Fenley Mark D | $98,940 | |
| Previous Owner | Purkle Kevin L | $83,800 | |
| Previous Owner | Wilbanks Mickey Holly | $75,900 |
Source: Public Records
Tax History Compared to Growth
Tax History
| Year | Tax Paid | Tax Assessment Tax Assessment Total Assessment is a certain percentage of the fair market value that is determined by local assessors to be the total taxable value of land and additions on the property. | Land | Improvement |
|---|---|---|---|---|
| 2024 | $2,039 | $80,307 | $20,000 | $60,307 |
| 2023 | $2,341 | $80,707 | $20,000 | $60,707 |
| 2022 | $1,679 | $56,615 | $12,000 | $44,615 |
| 2021 | $1,770 | $56,615 | $12,000 | $44,615 |
| 2020 | $1,774 | $56,615 | $12,000 | $44,615 |
| 2019 | $1,693 | $52,930 | $12,000 | $40,930 |
| 2018 | $1,672 | $52,930 | $12,000 | $40,930 |
| 2017 | $1,174 | $40,328 | $10,000 | $30,328 |
| 2016 | $1,246 | $39,264 | $10,000 | $29,264 |
| 2015 | $1,262 | $39,625 | $10,000 | $29,625 |
| 2014 | $1,186 | $35,866 | $5,880 | $29,986 |
| 2013 | -- | $34,801 | $5,880 | $28,921 |
Source: Public Records
Map
Nearby Homes
- 202 Deer Run Dr Unit 1
- 204 Deer Run Dr
- 91 Cypress Place
- 93 Cypress Place
- 89 Cypress Place
- 201 Deer Run Dr
- 201 Deer Run Dr Unit 1
- 203 Deer Run Dr Unit 1
- 87 Cypress Place
- 556 Cotton Creek Ln
- 206 Deer Run Dr
- 206 Deer Run Dr Unit 1
- 205 Deer Run Dr Unit 1
- 85 Cypress Place
- 95 Cypress Place
- 0 Cypress Place Unit 8692306
- 0 Cypress Place Unit 7141788
- 0 Cypress Place Unit 8957312
- 0 Cypress Place
- 208 Deer Run Dr