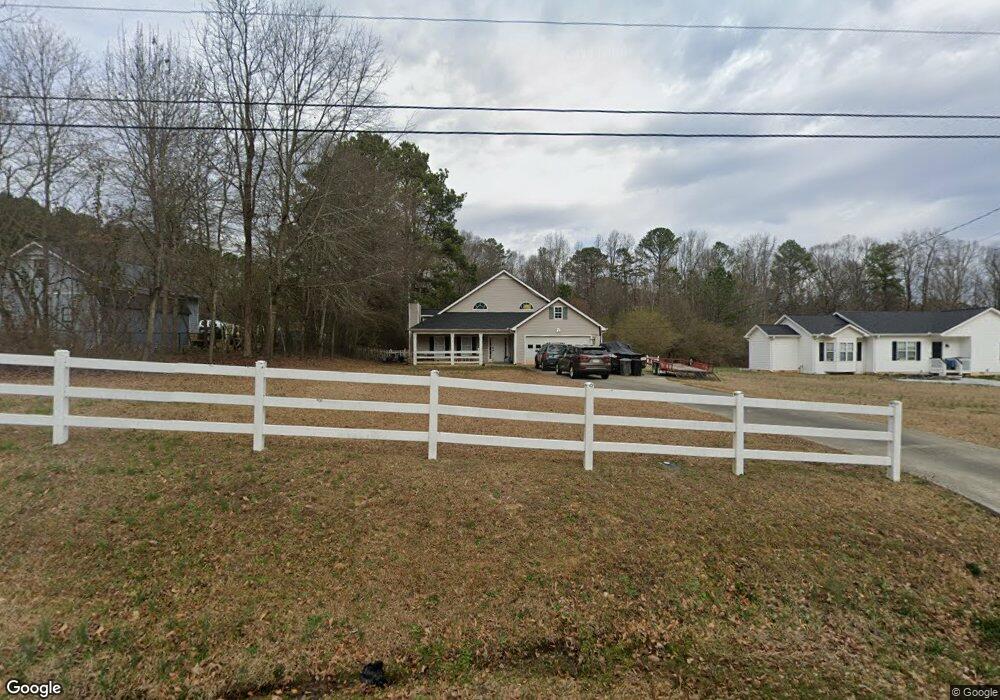
200 Double d Rd Temple, GA 30179
Estimated Value: $309,000 - $384,000
3
Beds
2
Baths
2,234
Sq Ft
$149/Sq Ft
Est. Value
About This Home
This home is located at 200 Double d Rd, Temple, GA 30179 and is currently estimated at $333,307, approximately $149 per square foot. 200 Double d Rd is a home located in Carroll County with nearby schools including Temple Elementary School, Temple Middle School, and Temple High School.
Ownership History
Date
Name
Owned For
Owner Type
Purchase Details
Closed on
Oct 18, 2011
Sold by
Smith Henry Robert
Bought by
Norris Dustin J
Current Estimated Value
Home Financials for this Owner
Home Financials are based on the most recent Mortgage that was taken out on this home.
Original Mortgage
$68,225
Outstanding Balance
$45,393
Interest Rate
3.75%
Mortgage Type
FHA
Estimated Equity
$287,914
Purchase Details
Closed on
Sep 23, 2010
Sold by
Lonas William James
Bought by
Hsbc Mtg Svcs Inc
Purchase Details
Closed on
Nov 12, 2004
Sold by
Secretary Of Hud
Bought by
Lonas William James
Purchase Details
Closed on
Apr 6, 2004
Sold by
Citimortgage Inc
Bought by
Secretary Of Hud
Purchase Details
Closed on
Mar 1, 2001
Sold by
A To Z Properties In
Bought by
Groves Linda
Purchase Details
Closed on
Aug 10, 2000
Sold by
Rjo Designer Homes
Bought by
A To Z Properties In
Create a Home Valuation Report for This Property
The Home Valuation Report is an in-depth analysis detailing your home's value as well as a comparison with similar homes in the area
Home Values in the Area
Average Home Value in this Area
Purchase History
| Date | Buyer | Sale Price | Title Company |
|---|---|---|---|
| Norris Dustin J | $70,000 | -- | |
| Hsbc Mtg Svcs Inc | $151,937 | -- | |
| Lonas William James | -- | -- | |
| Lonas William James | -- | -- | |
| Secretary Of Hud | -- | -- | |
| Citimortgage Inc | -- | -- | |
| Groves Linda | $121,500 | -- | |
| A To Z Properties In | $18,500 | -- |
Source: Public Records
Mortgage History
| Date | Status | Borrower | Loan Amount |
|---|---|---|---|
| Open | Hsbc Mtg Svcs Inc | $68,225 |
Source: Public Records
Tax History Compared to Growth
Tax History
| Year | Tax Paid | Tax Assessment Tax Assessment Total Assessment is a certain percentage of the fair market value that is determined by local assessors to be the total taxable value of land and additions on the property. | Land | Improvement |
|---|---|---|---|---|
| 2025 | $2,748 | $128,704 | $14,742 | $113,962 |
| 2024 | $2,773 | $128,704 | $14,742 | $113,962 |
| 2023 | $2,773 | $118,190 | $14,742 | $103,448 |
| 2022 | $2,283 | $92,766 | $9,828 | $82,938 |
| 2021 | $2,016 | $78,300 | $7,280 | $71,020 |
| 2020 | $1,829 | $69,995 | $7,280 | $62,715 |
| 2019 | $1,698 | $63,992 | $7,280 | $56,712 |
| 2018 | $1,555 | $56,160 | $7,280 | $48,880 |
| 2017 | $1,574 | $56,160 | $7,280 | $48,880 |
| 2016 | $1,579 | $56,160 | $7,280 | $48,880 |
| 2015 | $1,179 | $36,938 | $4,000 | $32,939 |
| 2014 | $1,185 | $36,939 | $4,000 | $32,939 |
Source: Public Records
Map
Nearby Homes
- 355 Double d Rd
- 216 Hunt Club Cir
- 161 E Highway 78
- 105 Fawn Ln
- 249 Carrollton St
- 28 Ringer St
- 234 Temple Terrace
- 161 U S 78
- 105 Maplewood Dr
- 18 E Johnson St Unit 172
- 18 E Johnson St
- 292 E Johnson St
- 119 E Johnson St
- 68 Villa Rosa Dr
- 238 James Allen Place
- 159 Villa Rosa Ridge
- 413 Daffodil Dr
- 108 Villa Rosa Ridge
- 511 Azalea Way
- 511 Azalea Way Unit 54
- 204 Double d Rd
- 111 Matthews Ln
- 8 Oak Ridge Rd
- 203 Double d Rd
- 203 Double d Rd
- 22 Matthews Ln
- 30 Matthews Ln
- 7 Oak Ridge Rd
- 170 Double d Rd
- 26 Oak Ridge Rd
- 160 Double d Rd
- 286 Katie St
- 244 Katie St
- 42 Oak Ridge Rd
- 19 Hickory Trail
- 235 Katie St
- 255 Katie St
- 25 Hickory Trail
- 296 Katie St
- 56 Oak Ridge Rd