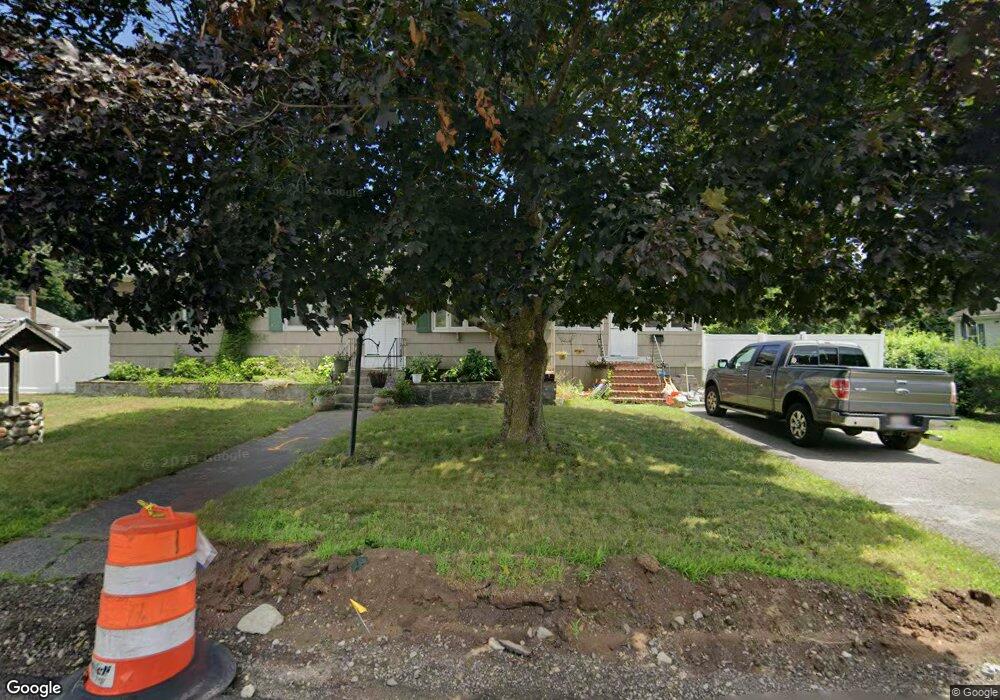
200 Douglas Rd Lowell, MA 01852
Belvidere NeighborhoodEstimated Value: $446,000 - $548,000
3
Beds
1
Bath
960
Sq Ft
$529/Sq Ft
Est. Value
About This Home
This home is located at 200 Douglas Rd, Lowell, MA 01852 and is currently estimated at $507,438, approximately $528 per square foot. 200 Douglas Rd is a home located in Middlesex County with nearby schools including Moody Elementary School, Abraham Lincoln Elementary School, and Greenhalge Elementary School.
Ownership History
Date
Name
Owned For
Owner Type
Purchase Details
Closed on
Jun 29, 2020
Sold by
Meade Brian J and Meade Paul J
Bought by
Ryder Alycia
Current Estimated Value
Home Financials for this Owner
Home Financials are based on the most recent Mortgage that was taken out on this home.
Original Mortgage
$300,457
Outstanding Balance
$266,920
Interest Rate
3.2%
Mortgage Type
FHA
Estimated Equity
$240,518
Purchase Details
Closed on
Sep 30, 2019
Sold by
Meade Ruth C
Bought by
Meade Ruth C and Meade Brian J
Purchase Details
Closed on
Sep 6, 1961
Bought by
Meade Ruth C
Create a Home Valuation Report for This Property
The Home Valuation Report is an in-depth analysis detailing your home's value as well as a comparison with similar homes in the area
Home Values in the Area
Average Home Value in this Area
Purchase History
| Date | Buyer | Sale Price | Title Company |
|---|---|---|---|
| Ryder Alycia | $306,000 | None Available | |
| Meade Ruth C | -- | -- | |
| Meade Ruth C | -- | -- | |
| Meade Ruth C | $15,500 | -- |
Source: Public Records
Mortgage History
| Date | Status | Borrower | Loan Amount |
|---|---|---|---|
| Open | Ryder Alycia | $300,457 |
Source: Public Records
Tax History
| Year | Tax Paid | Tax Assessment Tax Assessment Total Assessment is a certain percentage of the fair market value that is determined by local assessors to be the total taxable value of land and additions on the property. | Land | Improvement |
|---|---|---|---|---|
| 2025 | $5,502 | $479,300 | $222,000 | $257,300 |
| 2024 | $5,118 | $429,700 | $199,800 | $229,900 |
| 2023 | $4,849 | $390,400 | $173,700 | $216,700 |
| 2022 | $4,260 | $335,700 | $153,100 | $182,600 |
| 2021 | $4,111 | $305,400 | $133,200 | $172,200 |
| 2020 | $3,816 | $285,600 | $133,200 | $152,400 |
| 2019 | $3,598 | $256,300 | $127,300 | $129,000 |
| 2018 | $3,445 | $239,400 | $121,200 | $118,200 |
| 2017 | $3,297 | $221,000 | $107,700 | $113,300 |
| 2016 | $3,159 | $208,400 | $99,300 | $109,100 |
| 2015 | $3,181 | $205,500 | $99,300 | $106,200 |
| 2013 | $3,136 | $208,900 | $118,000 | $90,900 |
Source: Public Records
Map
Nearby Homes
- 251 Clark Rd
- 45 Clark Rd
- 67 Wedgemere Dr
- 42 Pentucket Ave
- 471 Butman Rd
- 206 Burnham Rd
- 313 Nesmith St
- 234 Nesmith St Unit 8
- 44 Hanks St
- 42 Christian St
- 200 Rogers St Unit 6
- 164 Bradley St
- 52 Christian St
- 100 Merrimack Ave Unit 25
- 100 Merrimack Ave Unit 9
- 31 Floyd Ave
- 194 River Rd
- Lots 1-12 Christian Hill Dev
- 81 Reservoir St
- 254 Pleasant St
Your Personal Tour Guide
Ask me questions while you tour the home.