Estimated Value: $137,000 - $163,000
--
Bed
1
Bath
1,351
Sq Ft
$109/Sq Ft
Est. Value
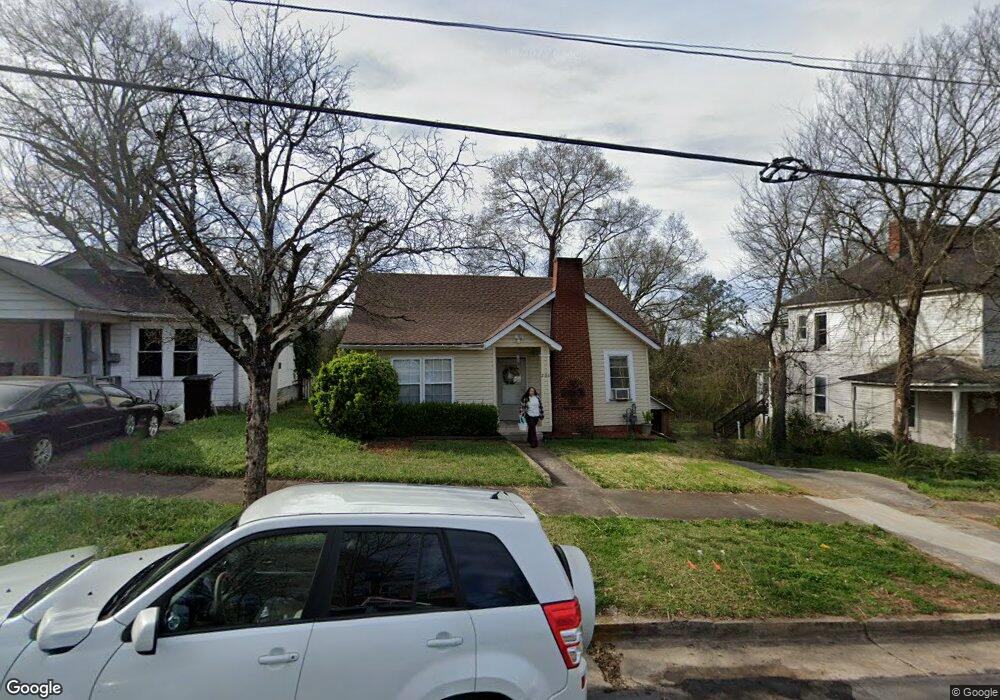
About This Home
This home is located at 200 E 10th St SW, Rome, GA 30161 and is currently estimated at $147,009, approximately $108 per square foot. 200 E 10th St SW is a home located in Floyd County with nearby schools including Rome High School, St. Mary School, and Darlington School.
Ownership History
Date
Name
Owned For
Owner Type
Purchase Details
Closed on
May 19, 1999
Sold by
Gosa Carol A
Bought by
Orellana Jose and Bersi Orellana
Current Estimated Value
Purchase Details
Closed on
Feb 20, 1998
Bought by
P and R
Purchase Details
Closed on
Feb 17, 1998
Sold by
Gosa Bobby L and Gosa Carol A
Bought by
Gosa Carol A
Purchase Details
Closed on
May 6, 1993
Sold by
Barnard Betty Jane F and Barnard K
Bought by
Gosa Bobby L and Gosa Carol A
Purchase Details
Closed on
Jul 19, 1991
Sold by
Bice Mrs Betty Jane
Bought by
Barnard Betty Jane F and Barnard K
Purchase Details
Closed on
Jan 1, 1966
Sold by
Bice Mrs Betty Jane
Bought by
Barnard Mrs Betty Jane
Purchase Details
Closed on
Dec 1, 1964
Sold by
Bice James Warren and Randall Barnard Bett
Bought by
Bice Mrs Betty Jane
Purchase Details
Closed on
Jan 1, 1950
Sold by
Tayulor J W
Bought by
Taylor J W
Purchase Details
Closed on
Jan 1, 1901
Bought by
Tayulor J W
Create a Home Valuation Report for This Property
The Home Valuation Report is an in-depth analysis detailing your home's value as well as a comparison with similar homes in the area
Home Values in the Area
Average Home Value in this Area
Purchase History
| Date | Buyer | Sale Price | Title Company |
|---|---|---|---|
| Orellana Jose | $43,300 | -- | |
| P | -- | -- | |
| Gosa Carol A | -- | -- | |
| Gosa Bobby L | $65,000 | -- | |
| Barnard Betty Jane F | -- | -- | |
| Barnard Mrs Betty Jane | -- | -- | |
| Bice Mrs Betty Jane | -- | -- | |
| Taylor J W | -- | -- | |
| Tayulor J W | -- | -- |
Source: Public Records
Tax History
| Year | Tax Paid | Tax Assessment Tax Assessment Total Assessment is a certain percentage of the fair market value that is determined by local assessors to be the total taxable value of land and additions on the property. | Land | Improvement |
|---|---|---|---|---|
| 2025 | $1,668 | $52,222 | $4,832 | $47,390 |
| 2024 | $1,668 | $47,994 | $4,393 | $43,601 |
| 2023 | $1,700 | $40,628 | $3,994 | $36,634 |
| 2022 | $1,210 | $33,147 | $3,195 | $29,952 |
| 2021 | $1,106 | $29,819 | $3,195 | $26,624 |
| 2020 | $646 | $17,265 | $2,496 | $14,769 |
| 2019 | $602 | $16,267 | $2,496 | $13,771 |
| 2018 | $559 | $15,110 | $2,496 | $12,614 |
| 2017 | $537 | $14,497 | $2,496 | $12,001 |
| 2016 | $510 | $13,726 | $2,480 | $11,246 |
| 2015 | $481 | $13,726 | $2,480 | $11,246 |
| 2014 | $481 | $13,726 | $2,480 | $11,246 |
Source: Public Records
Map
Nearby Homes
- 803/805 Maple Ave SW
- 803/80 Maple Ave SW
- 31 Notasulga Dr SW
- 162 E 11th St SE
- 170 E 11th St SW
- 9 Eastridge Ct SW
- 168 E 11th St SE
- 164 E 11th St SE
- 166 E 11th St SW
- 1 E 11th St SW
- 419 E 13th St SW
- 1011 Walnut Ave SW
- 801 Maple Ave SW
- 209 Moultrie Ln SE
- 415 E 10th St SE
- 416 E 9th St SE
- 2 Coral Ave SW
- 39 E 16th St SW
- 1312 E 2nd Ave SE
- 307 E 11th St SE
- 202 E 10th St SW
- 204 E 10th St SW
- E E 10th St Unit 10
- E E 10th St Unit 1
- E E 10th St
- 106 E 10th St SW
- 104 E 10th St SW
- 403 E 12th St SW
- 201 E 10th St SW
- 401 E 12th St SW
- 203 E 10th St SW
- 102 E 10th St SW
- 926 Darlington Way SW
- 405 E 12th St SW
- 924 Darlington Way SW
- 309 E 12th St SW
- 101 E 10th St SW
- 307 E 12th St SW
- 921 Darlington Way SW
- 1003 Maple Ave SW
Your Personal Tour Guide
Ask me questions while you tour the home.