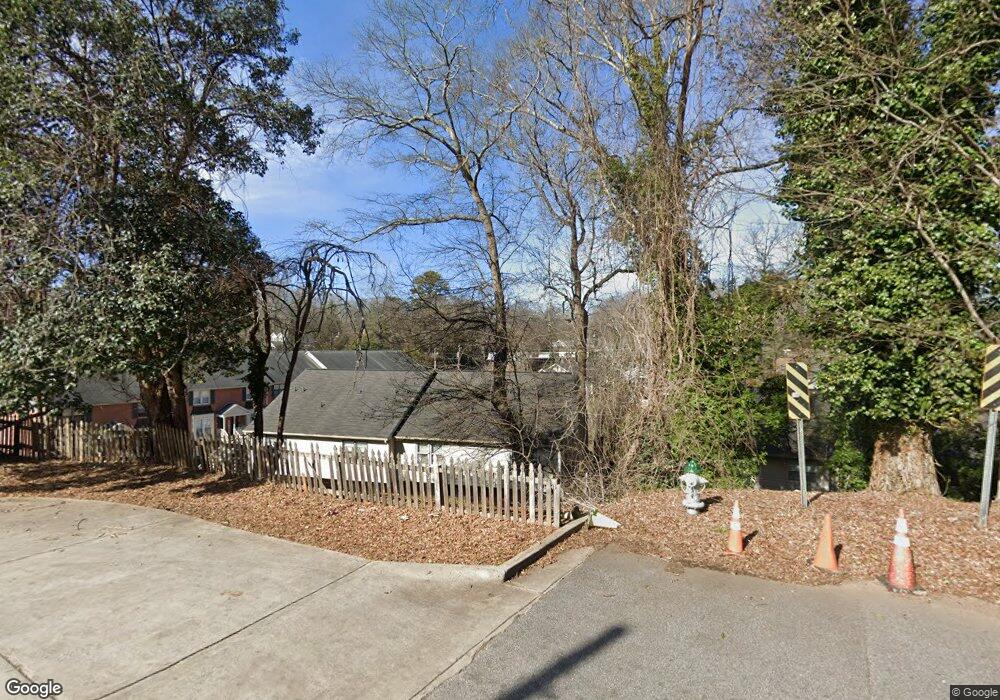
200 E Cloverhurst Ave Athens, GA 30605
Midtown-Bloomfield NeighborhoodEstimated Value: $404,161 - $524,000
Studio
--
Bath
1,184
Sq Ft
$374/Sq Ft
Est. Value
About This Home
This home is located at 200 E Cloverhurst Ave, Athens, GA 30605 and is currently estimated at $442,290, approximately $373 per square foot. 200 E Cloverhurst Ave is a home located in Clarke County with nearby schools including Barrow Elementary School, Clarke Middle School, and Clarke Central High School.
Ownership History
Date
Name
Owned For
Owner Type
Purchase Details
Closed on
Nov 15, 2022
Sold by
Bond C Herbert
Bought by
Reaves Jeffrey and Reaves Mariellen
Current Estimated Value
Home Financials for this Owner
Home Financials are based on the most recent Mortgage that was taken out on this home.
Original Mortgage
$218,250
Outstanding Balance
$211,262
Interest Rate
6.95%
Mortgage Type
New Conventional
Estimated Equity
$231,028
Purchase Details
Closed on
Nov 15, 2001
Sold by
Bond Dorrie R
Bought by
Bond Jtro Bond C and Bond Bond
Purchase Details
Closed on
Jan 26, 2000
Sold by
Ziomek Henry K and Ziomek Patricia A
Bought by
Bond Dorrie R
Purchase Details
Closed on
Oct 23, 1996
Sold by
Ziomek Henry K and Ziomek As Patricia A
Bought by
Ziomek Henry K and Ziomek Patricia A
Purchase Details
Closed on
Mar 9, 1989
Sold by
Ziomek John
Bought by
Ziomek John Henry K Ziomek
Create a Home Valuation Report for This Property
The Home Valuation Report is an in-depth analysis detailing your home's value as well as a comparison with similar homes in the area
Home Values in the Area
Average Home Value in this Area
Purchase History
| Date | Buyer | Sale Price | Title Company |
|---|---|---|---|
| Reaves Jeffrey | $291,000 | -- | |
| Bond Jtro Bond C | -- | -- | |
| Bond Dorrie R | $74,000 | -- | |
| Ziomek Henry K | -- | -- | |
| Ziomek John Henry K Ziomek | -- | -- |
Source: Public Records
Mortgage History
| Date | Status | Borrower | Loan Amount |
|---|---|---|---|
| Open | Reaves Jeffrey | $218,250 |
Source: Public Records
Tax History
| Year | Tax Paid | Tax Assessment Tax Assessment Total Assessment is a certain percentage of the fair market value that is determined by local assessors to be the total taxable value of land and additions on the property. | Land | Improvement |
|---|---|---|---|---|
| 2025 | $4,351 | $140,117 | $16,000 | $124,117 |
| 2024 | $4,351 | $125,823 | $16,000 | $109,823 |
| 2023 | $3,932 | $110,568 | $14,000 | $96,568 |
| 2022 | $2,572 | $80,618 | $14,000 | $66,618 |
| 2021 | $2,235 | $66,334 | $14,000 | $52,334 |
| 2020 | $2,208 | $65,515 | $14,000 | $51,515 |
| 2019 | $1,984 | $58,428 | $14,000 | $44,428 |
| 2018 | $1,831 | $53,933 | $14,000 | $39,933 |
| 2017 | $1,831 | $53,933 | $14,000 | $39,933 |
| 2016 | $1,808 | $53,241 | $14,000 | $39,241 |
| 2015 | $1,810 | $53,241 | $14,000 | $39,241 |
| 2014 | $1,830 | $53,732 | $14,000 | $39,732 |
Source: Public Records
Map
Nearby Homes
- 255 Bloomfield St
- 1515 S Lumpkin St
- 997 S Milledge Ave Unit 3
- 997 S Milledge Ave Unit 2
- 170 Northview Dr Unit 5
- 1554 S Lumpkin St Unit 4
- 1554 S Lumpkin St Unit 6
- 1554 S Lumpkin St Unit 5
- 1554 S Lumpkin St Unit 1
- 1554 S Lumpkin St Unit 3
- 1554 S Lumpkin St Unit 7
- 1554 S Lumpkin St Unit 2
- 494 Baxter St Unit 22
- 362 W Cloverhurst Ave
- 265 Springdale St
- 935 Baxter St Unit 3
- 230 Woodlawn Ave
- 303 S Church St
- 303 S Church St Unit 6
- 577 W Cloverhurst Ave
- 200 E Cloverhurst Ave Unit 8
- 200 E Cloverhurst Ave Unit 4
- 200 E Cloverhurst Ave Unit 10
- 200 E Cloverhurst Ave Unit 16
- 200 E Cloverhurst Ave Unit 2
- 200 E Cloverhurst Ave
- 200 E Cloverhurst Ave Unit 7
- 200 E Cloverhurst Ave
- 200 E Cloverhurst Ave
- 200 E Cloverhurst Ave
- 200 E Cloverhurst Ave
- 200 E Cloverhurst Ave
- 200 E Cloverhurst Ave
- 200 E Cloverhurst Ave
- 200 E Cloverhurst Ave
- 200 E Cloverhurst Ave
- 200 E Cloverhurst Ave
- 200 E Cloverhurst Ave
- 200 E Cloverhurst Ave
- 200 E Cloverhurst Ave
Your Personal Tour Guide
Ask me questions while you tour the home.