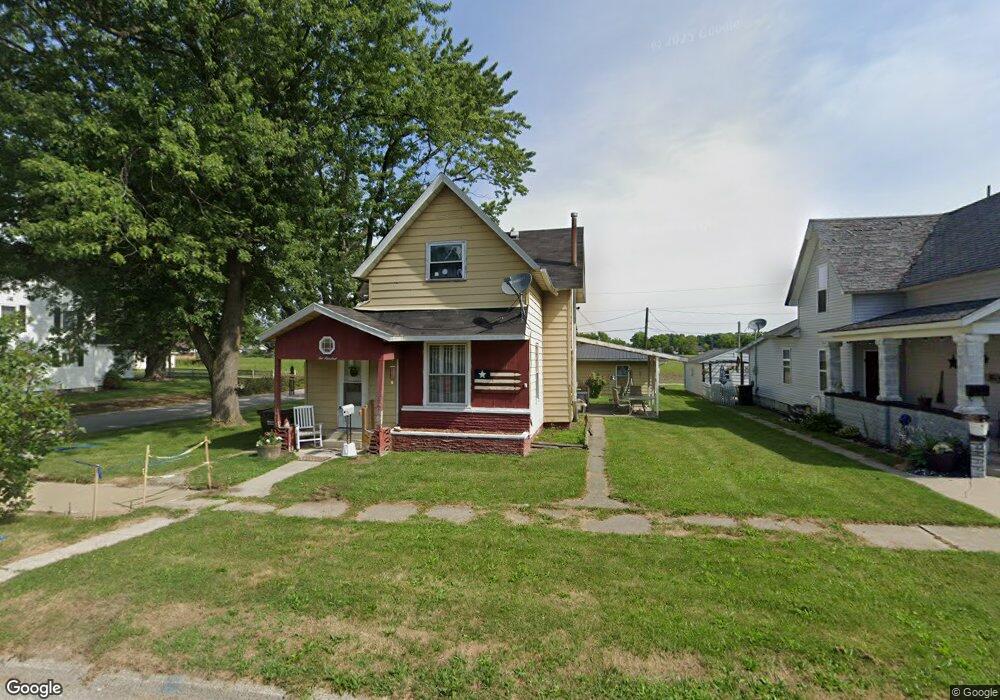
200 E Covell St Garrett, IN 46738
Estimated Value: $128,000 - $163,000
2
Beds
1
Bath
1,172
Sq Ft
$126/Sq Ft
Est. Value
About This Home
This home is located at 200 E Covell St, Garrett, IN 46738 and is currently estimated at $147,479, approximately $125 per square foot. 200 E Covell St is a home located in DeKalb County with nearby schools including J.E. Ober Elementary School, Garrett Middle School, and Garrett High School.
Ownership History
Date
Name
Owned For
Owner Type
Purchase Details
Closed on
May 3, 2008
Sold by
Babcock Linda Sue and Babcock Wilbur J
Bought by
Bickley Georganna F
Current Estimated Value
Home Financials for this Owner
Home Financials are based on the most recent Mortgage that was taken out on this home.
Original Mortgage
$52,515
Outstanding Balance
$32,493
Interest Rate
5.87%
Mortgage Type
Adjustable Rate Mortgage/ARM
Estimated Equity
$114,986
Purchase Details
Closed on
Nov 10, 2005
Sold by
Rock Cynthia M
Bought by
Wells Fargo Bank N A
Purchase Details
Closed on
Oct 6, 2005
Sold by
Wells Fargo Bank N A
Bought by
The Secretary Of Hud
Purchase Details
Closed on
Jul 26, 2005
Sold by
Secretary Of Hud
Bought by
Babcock Linda Sue and Babcock Ii Wilbur J
Home Financials for this Owner
Home Financials are based on the most recent Mortgage that was taken out on this home.
Original Mortgage
$50,400
Interest Rate
6.34%
Mortgage Type
New Conventional
Create a Home Valuation Report for This Property
The Home Valuation Report is an in-depth analysis detailing your home's value as well as a comparison with similar homes in the area
Home Values in the Area
Average Home Value in this Area
Purchase History
| Date | Buyer | Sale Price | Title Company |
|---|---|---|---|
| Bickley Georganna F | -- | None Available | |
| Wells Fargo Bank N A | $67,228 | None Available | |
| The Secretary Of Hud | -- | None Available | |
| Babcock Linda Sue | -- | None Available |
Source: Public Records
Mortgage History
| Date | Status | Borrower | Loan Amount |
|---|---|---|---|
| Open | Bickley Georganna F | $52,515 | |
| Previous Owner | Babcock Linda Sue | $50,400 |
Source: Public Records
Tax History
| Year | Tax Paid | Tax Assessment Tax Assessment Total Assessment is a certain percentage of the fair market value that is determined by local assessors to be the total taxable value of land and additions on the property. | Land | Improvement |
|---|---|---|---|---|
| 2025 | $546 | $109,600 | $29,200 | $80,400 |
| 2024 | $546 | $92,200 | $27,300 | $64,900 |
| 2023 | $395 | $82,400 | $23,800 | $58,600 |
| 2022 | $441 | $81,600 | $23,100 | $58,500 |
| 2021 | $341 | $72,900 | $22,000 | $50,900 |
| 2020 | $300 | $63,500 | $16,500 | $47,000 |
| 2019 | $288 | $62,000 | $16,500 | $45,500 |
| 2018 | $299 | $62,000 | $16,500 | $45,500 |
| 2017 | $387 | $74,800 | $16,500 | $58,300 |
| 2016 | $389 | $74,500 | $16,500 | $58,000 |
| 2014 | $369 | $72,700 | $16,500 | $56,200 |
Source: Public Records
Map
Nearby Homes
- 303 Latigo Ln
- 317 Conductor Cove
- 311 Maxine Dr
- 202 E King St
- 208 S Franklin St
- 219 S Harrison St
- 312 S Lee St
- 310 S Harrison St
- 401 S Randolph St
- 217 S Johnson St
- 404 S Peters St
- 1123 Indiana 8
- 1316 S Lee St
- 711 S Cowen St
- 600 E South St
- 910 S Ijams St
- 0 S Colony Dr
- 215 Latigo Ln
- 818 Gullet Ave
- 1106 S Ijams St
- 204 E Covell St
- 112 E Covell St
- 617 N Franklin St
- 612 N Franklin St
- 211 E Covell St
- 216 E Covell St
- 108 E Covell St
- 213 E Covell St
- 217 E Covell St
- 202 E High St
- 116 E High St
- 208 E High St
- 212 E High St
- 703 N Randolph St
- 200 E High St
- 619 N Randolph St
- 214 E High St
- 711 N Randolph St
- 300 E Covell St
- 617 N Randolph St
Your Personal Tour Guide
Ask me questions while you tour the home.