200 E Depot St Lagrange, GA 30241
Estimated Value: $647,674
Studio
5
Baths
4,970
Sq Ft
$130/Sq Ft
Est. Value
About This Home
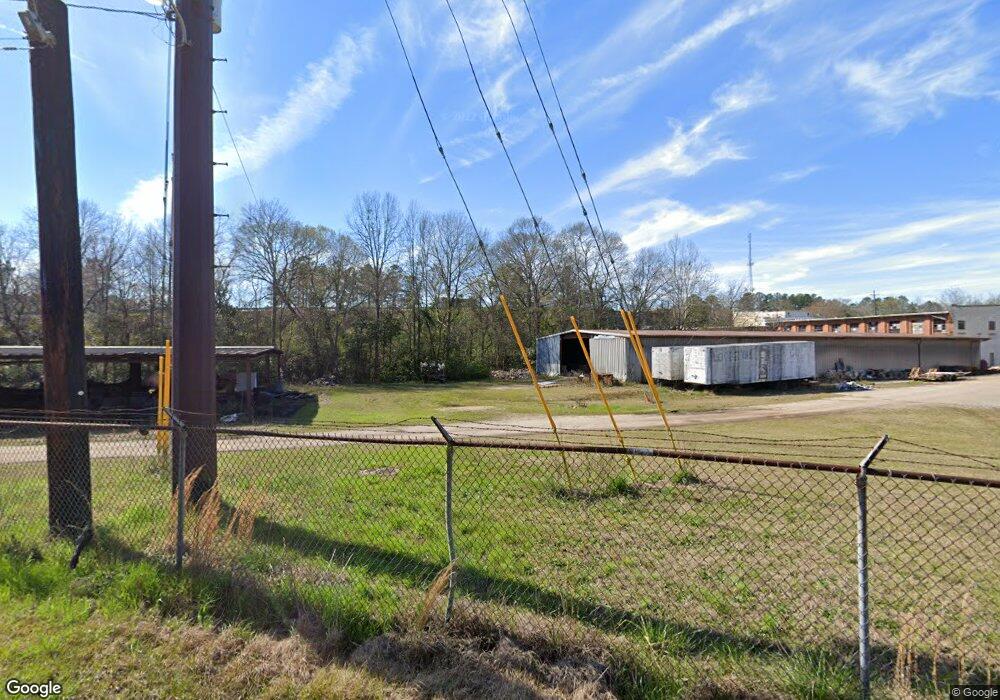
This home is located at 200 E Depot St, Lagrange, GA 30241 and is currently priced at $647,674, approximately $130 per square foot. 200 E Depot St is a home located in Troup County with nearby schools including Hollis Hand Elementary School, Franklin Forest Elementary School, and Ethel W. Kight Elementary School.
Ownership History
Date
Name
Owned For
Owner Type
Purchase Details
Closed on
Jan 20, 2023
Sold by
Ideal Electrical Contractors Inc
Bought by
Rail District Enterprises Llc
Current Estimated Value
Purchase Details
Closed on
Jan 25, 2003
Sold by
Easement
Bought by
Ideal Electrical Contractors
Purchase Details
Closed on
Jan 24, 2003
Sold by
Easement
Bought by
Easement
Purchase Details
Closed on
Jan 23, 2003
Sold by
Easement
Bought by
Easement
Purchase Details
Closed on
Jun 21, 2001
Sold by
Newman Construction Co
Bought by
Easement
Purchase Details
Closed on
Jan 1, 1963
Sold by
Gibson Eugnie
Bought by
Newman Construction Co
Purchase Details
Closed on
Apr 1, 1962
Sold by
Martin D S
Bought by
Gibson Eugnie
Purchase Details
Closed on
Jan 1, 1961
Sold by
Martin D S
Bought by
Martin D S
Purchase Details
Closed on
Jul 1, 1954
Sold by
Daniel M E
Bought by
Martin D S
Create a Home Valuation Report for This Property
The Home Valuation Report is an in-depth analysis detailing your home's value as well as a comparison with similar homes in the area
Purchase History
| Date | Buyer | Sale Price | Title Company |
|---|---|---|---|
| Rail District Enterprises Llc | $570,000 | -- | |
| Ideal Electrical Contractors | -- | -- | |
| Easement | -- | -- | |
| Easement | -- | -- | |
| Easement | $540,000 | -- | |
| Newman Construction Co | -- | -- | |
| Gibson Eugnie | -- | -- | |
| Martin D S | -- | -- | |
| Martin D S | -- | -- |
Source: Public Records
Tax History Compared to Growth
Tax History
| Year | Tax Paid | Tax Assessment Tax Assessment Total Assessment is a certain percentage of the fair market value that is determined by local assessors to be the total taxable value of land and additions on the property. | Land | Improvement |
|---|---|---|---|---|
| 2025 | $4,935 | $180,964 | $14,000 | $166,964 |
| 2024 | $4,935 | $180,964 | $14,000 | $166,964 |
| 2023 | $6,218 | $2,400 | $0 | $2,400 |
| 2022 | $6,970 | $249,740 | $70,000 | $179,740 |
| 2021 | $6,538 | $216,776 | $51,680 | $165,096 |
| 2020 | $6,538 | $216,776 | $51,680 | $165,096 |
| 2019 | $7,822 | $259,340 | $51,880 | $207,460 |
| 2018 | $7,821 | $259,340 | $51,880 | $207,460 |
| 2017 | $7,822 | $259,340 | $51,880 | $207,460 |
| 2016 | $7,812 | $259,022 | $51,900 | $207,122 |
| 2015 | $6,878 | $227,678 | $51,900 | $175,778 |
| 2014 | $6,981 | $230,688 | $51,900 | $178,788 |
| 2013 | -- | $230,688 | $51,900 | $178,788 |
Source: Public Records
Map
Nearby Homes