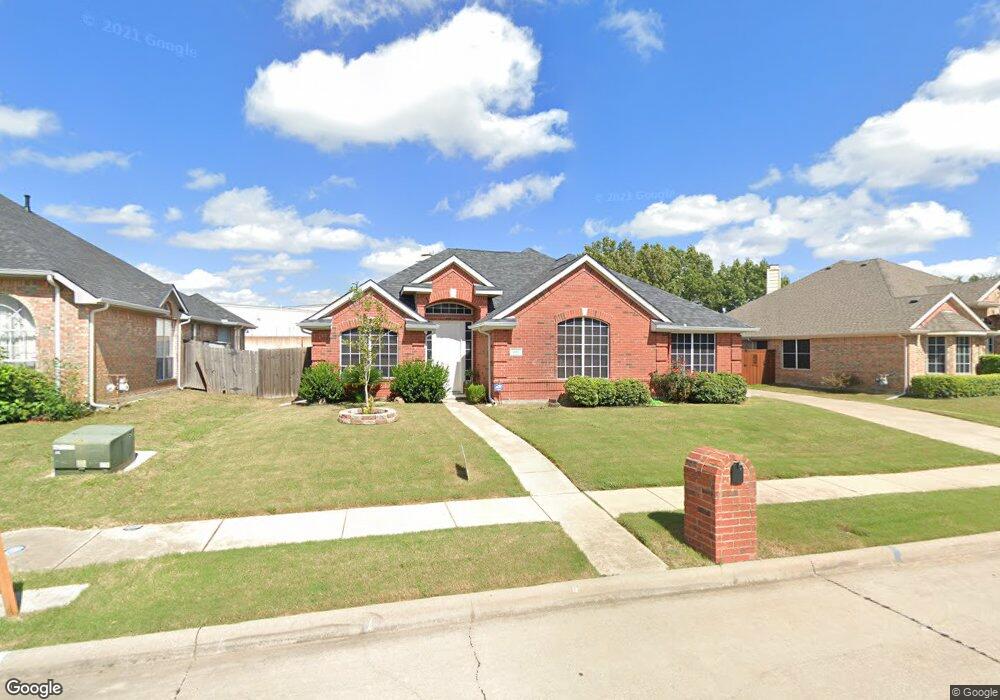
200 Elmcrest Dr Murphy, TX 75094
Estimated Value: $399,654 - $446,000
3
Beds
2
Baths
1,790
Sq Ft
$232/Sq Ft
Est. Value
About This Home
This home is located at 200 Elmcrest Dr, Murphy, TX 75094 and is currently estimated at $414,914, approximately $231 per square foot. 200 Elmcrest Dr is a home located in Collin County with nearby schools including Miller Elementary School, Murphy Middle School, and C A Mcmillen High School.
Ownership History
Date
Name
Owned For
Owner Type
Purchase Details
Closed on
Mar 7, 2002
Sold by
Cendant Mobility Financial Corp
Bought by
Nguyen Long and Troung Christina
Current Estimated Value
Home Financials for this Owner
Home Financials are based on the most recent Mortgage that was taken out on this home.
Original Mortgage
$143,863
Interest Rate
7.11%
Purchase Details
Closed on
Mar 5, 2002
Sold by
Delena Jesse and Delena Trina M
Bought by
Cendant Mobility Financial Corp
Home Financials for this Owner
Home Financials are based on the most recent Mortgage that was taken out on this home.
Original Mortgage
$143,863
Interest Rate
7.11%
Purchase Details
Closed on
Nov 14, 1996
Sold by
U S Home Corp
Bought by
Delena Jesse and Delena Trina M
Home Financials for this Owner
Home Financials are based on the most recent Mortgage that was taken out on this home.
Original Mortgage
$117,383
Interest Rate
8.05%
Mortgage Type
FHA
Create a Home Valuation Report for This Property
The Home Valuation Report is an in-depth analysis detailing your home's value as well as a comparison with similar homes in the area
Home Values in the Area
Average Home Value in this Area
Purchase History
| Date | Buyer | Sale Price | Title Company |
|---|---|---|---|
| Nguyen Long | -- | -- | |
| Cendant Mobility Financial Corp | -- | -- | |
| Delena Jesse | -- | -- |
Source: Public Records
Mortgage History
| Date | Status | Borrower | Loan Amount |
|---|---|---|---|
| Previous Owner | Nguyen Long | $143,863 | |
| Previous Owner | Delena Jesse | $117,383 |
Source: Public Records
Tax History
| Year | Tax Paid | Tax Assessment Tax Assessment Total Assessment is a certain percentage of the fair market value that is determined by local assessors to be the total taxable value of land and additions on the property. | Land | Improvement |
|---|---|---|---|---|
| 2025 | $4,188 | $358,222 | $109,250 | $292,293 |
| 2024 | $4,188 | $325,656 | $109,250 | $295,640 |
| 2023 | $4,188 | $296,051 | $109,250 | $261,013 |
| 2022 | $5,271 | $269,137 | $95,000 | $230,092 |
| 2021 | $5,053 | $244,670 | $76,000 | $168,670 |
| 2020 | $5,035 | $241,063 | $66,500 | $174,563 |
| 2019 | $5,183 | $236,579 | $66,500 | $170,079 |
| 2018 | $5,126 | $231,846 | $66,500 | $168,835 |
| 2017 | $4,660 | $212,520 | $66,500 | $146,020 |
| 2016 | $4,289 | $204,869 | $57,000 | $147,869 |
| 2015 | $3,430 | $177,059 | $42,750 | $134,309 |
Source: Public Records
Map
Nearby Homes
- 101 Hawthorne Dr
- 308 Rolling Oak Dr
- 300 Shady Timbers Ln
- 202 Sweetgum Dr
- 316 Mimosa Dr
- 1008 Yarnell Place
- 322 Willow Wood St
- 428 Rainforest Ct
- 342 Willow Wood St
- 110 Birch Blvd
- 356 Willow Wood St
- 5924 Mulvane Dr
- 524 Jasmine Dr
- 600 E Fm 544
- 401 N Maxwell Creek Rd
- 305 Ryan Ct
- 465 Kinney Dr
- 108 Starlite Dr
- 402 S Maxwell Creek Rd
- 138 Creekside Dr
- 134 Elmcrest Dr
- 204 Elmcrest Dr
- 130 Elmcrest Dr
- 201 Elmcrest Dr
- 206 Elmcrest Dr
- 133 Elmcrest Dr
- 205 Elmcrest Dr
- 129 Elmcrest Dr
- 126 Elmcrest Dr
- 204 Forest Ln
- 125 Elmcrest Dr
- 208 Forest Ln
- 200 Timberbluff Ln
- 134 Timberbluff Ln
- 122 Elmcrest Dr
- 204 Timberbluff Ln
- 130 Timberbluff Ln
- 212 Forest Ln
- 121 Elmcrest Dr
- 201 Hawthorne Dr
Your Personal Tour Guide
Ask me questions while you tour the home.