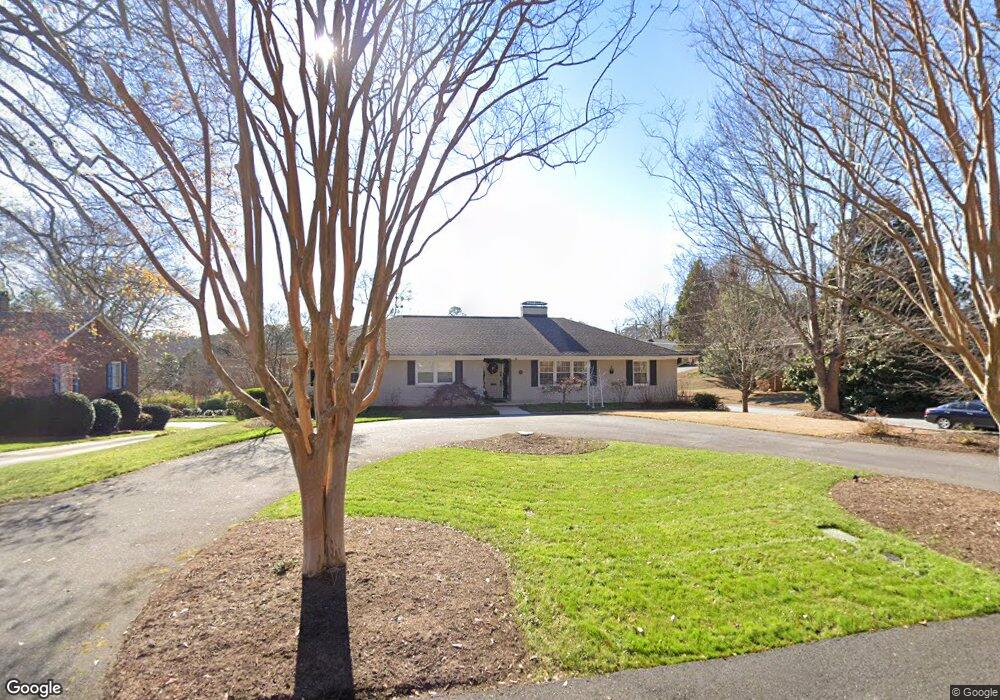
200 Emory Rd Spartanburg, SC 29307
Fernwood NeighborhoodEstimated Value: $487,000 - $505,000
4
Beds
3
Baths
3,254
Sq Ft
$152/Sq Ft
Est. Value
About This Home
This home is located at 200 Emory Rd, Spartanburg, SC 29307 and is currently estimated at $494,967, approximately $152 per square foot. 200 Emory Rd is a home located in Spartanburg County with nearby schools including Spartanburg High School, Westminster Day School, and Spartanburg Day School.
Ownership History
Date
Name
Owned For
Owner Type
Purchase Details
Closed on
Mar 5, 2025
Sold by
Shea Michael A and Shea Lisa W
Bought by
Strauss Matthew and Strauss Caroline
Current Estimated Value
Home Financials for this Owner
Home Financials are based on the most recent Mortgage that was taken out on this home.
Original Mortgage
$470,155
Outstanding Balance
$467,790
Interest Rate
6.96%
Mortgage Type
New Conventional
Estimated Equity
$27,177
Purchase Details
Closed on
Feb 27, 2009
Sold by
Pereyo Bobby and Pereyo Melissa
Bought by
Shea Michael A and Shea Lisa W
Home Financials for this Owner
Home Financials are based on the most recent Mortgage that was taken out on this home.
Original Mortgage
$222,400
Interest Rate
5.15%
Mortgage Type
Purchase Money Mortgage
Purchase Details
Closed on
Mar 4, 2005
Sold by
Justice Shannon L
Bought by
Pereyo Bobby and Pereyo Melissa
Purchase Details
Closed on
Sep 16, 2002
Sold by
Daniels Mary A
Bought by
Justice Shannon L
Create a Home Valuation Report for This Property
The Home Valuation Report is an in-depth analysis detailing your home's value as well as a comparison with similar homes in the area
Home Values in the Area
Average Home Value in this Area
Purchase History
| Date | Buyer | Sale Price | Title Company |
|---|---|---|---|
| Strauss Matthew | $494,900 | None Listed On Document | |
| Shea Michael A | $278,000 | -- | |
| Pereyo Bobby | $265,000 | -- | |
| Justice Shannon L | $110,000 | -- |
Source: Public Records
Mortgage History
| Date | Status | Borrower | Loan Amount |
|---|---|---|---|
| Open | Strauss Matthew | $470,155 | |
| Previous Owner | Shea Michael A | $222,400 |
Source: Public Records
Tax History Compared to Growth
Tax History
| Year | Tax Paid | Tax Assessment Tax Assessment Total Assessment is a certain percentage of the fair market value that is determined by local assessors to be the total taxable value of land and additions on the property. | Land | Improvement |
|---|---|---|---|---|
| 2025 | $3,644 | $12,784 | $2,920 | $9,864 |
| 2024 | $3,644 | $12,784 | $2,920 | $9,864 |
| 2023 | $3,644 | $12,784 | $2,920 | $9,864 |
| 2022 | $3,446 | $12,379 | $1,963 | $10,416 |
| 2021 | $3,446 | $12,379 | $1,963 | $10,416 |
| 2020 | $3,415 | $12,379 | $1,963 | $10,416 |
| 2019 | $3,415 | $12,379 | $1,963 | $10,416 |
| 2018 | $3,415 | $12,379 | $1,963 | $10,416 |
| 2017 | $3,029 | $10,764 | $2,000 | $8,764 |
| 2016 | $3,850 | $13,888 | $2,000 | $11,888 |
| 2015 | $2,902 | $10,764 | $2,000 | $8,764 |
| 2014 | $2,897 | $10,764 | $2,000 | $8,764 |
Source: Public Records
Map
Nearby Homes
- 506 Fernwood Dr
- 109 Kent Place
- 101 Kent Place
- 109 Pinetree Cir
- 128 Applewood Ln
- 115 Elderberry Dr
- 183 Boxwood Ln
- 115 Fernbrook Cir
- 21 Forest Oaks Way
- 102 Gable Ct
- 108 Auburn Ct
- 107 Gable Ct
- 111 Greenbriar Rd
- 915 Brentwood Dr
- 908 Brentwood Dr
- 1585 Old Charlotte Rd
- 115 Pheasant Dr
- 126 Towles Ct
- 1168 Maryland Ave
- 910 Gibbons St