Estimated Value: $127,000 - $144,000
3
Beds
1
Bath
1,064
Sq Ft
$128/Sq Ft
Est. Value
About This Home
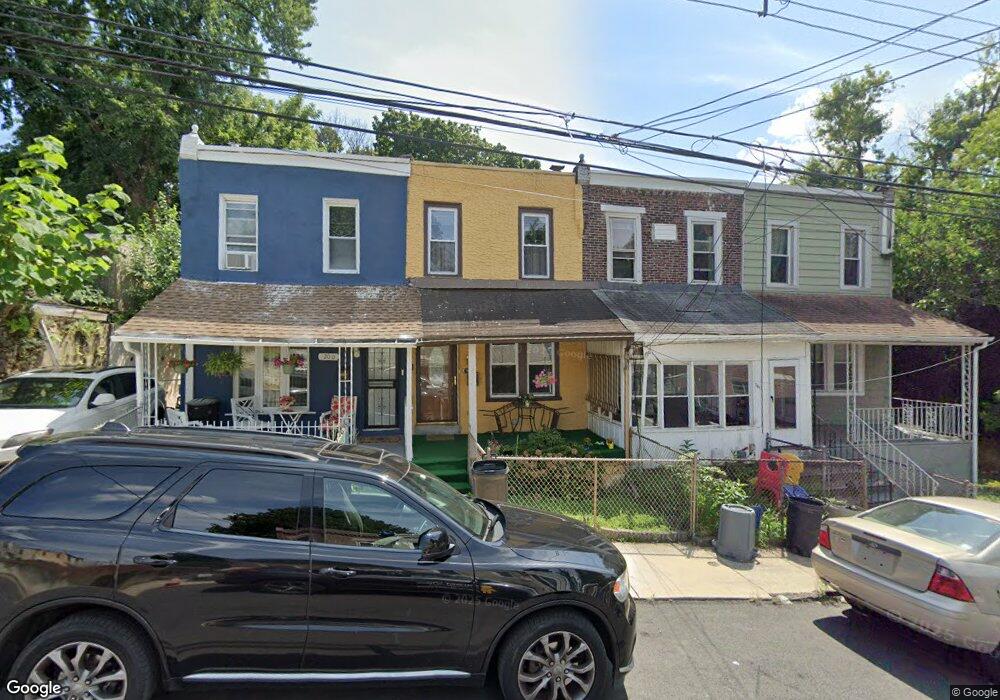
This home is located at 200 Fern St, Darby, PA 19023 and is currently estimated at $136,054, approximately $127 per square foot. 200 Fern St is a home located in Delaware County with nearby schools including Bell Avenue Elementary School, Penn Wood Middle School, and Penn Wood High School - Cypress Street Campus.
Ownership History
Date
Name
Owned For
Owner Type
Purchase Details
Closed on
Mar 28, 2005
Sold by
Oliver Craig T and Dickens Nikeaua Renee
Bought by
Whitfield Deborah
Current Estimated Value
Home Financials for this Owner
Home Financials are based on the most recent Mortgage that was taken out on this home.
Original Mortgage
$31,500
Outstanding Balance
$16,255
Interest Rate
5.78%
Mortgage Type
Fannie Mae Freddie Mac
Estimated Equity
$119,799
Purchase Details
Closed on
Apr 4, 2001
Sold by
Mellon Bank Na
Bought by
Oliver Craig T
Purchase Details
Closed on
Aug 5, 1999
Sold by
Headlam Corbin L
Bought by
Penna Housing Finance Agency
Purchase Details
Closed on
May 31, 1994
Sold by
Jorden Larry T and Jorden Fern Woodard
Bought by
Headlam Corbin L
Home Financials for this Owner
Home Financials are based on the most recent Mortgage that was taken out on this home.
Original Mortgage
$38,000
Interest Rate
8.55%
Mortgage Type
Purchase Money Mortgage
Create a Home Valuation Report for This Property
The Home Valuation Report is an in-depth analysis detailing your home's value as well as a comparison with similar homes in the area
Home Values in the Area
Average Home Value in this Area
Purchase History
| Date | Buyer | Sale Price | Title Company |
|---|---|---|---|
| Whitfield Deborah | $35,000 | -- | |
| Oliver Craig T | $8,900 | -- | |
| Penna Housing Finance Agency | -- | -- | |
| Headlam Corbin L | $40,000 | -- |
Source: Public Records
Mortgage History
| Date | Status | Borrower | Loan Amount |
|---|---|---|---|
| Open | Whitfield Deborah | $31,500 | |
| Previous Owner | Headlam Corbin L | $38,000 |
Source: Public Records
Tax History Compared to Growth
Tax History
| Year | Tax Paid | Tax Assessment Tax Assessment Total Assessment is a certain percentage of the fair market value that is determined by local assessors to be the total taxable value of land and additions on the property. | Land | Improvement |
|---|---|---|---|---|
| 2025 | $2,993 | $60,450 | $20,330 | $40,120 |
| 2024 | $2,993 | $60,450 | $20,330 | $40,120 |
| 2023 | $2,816 | $60,450 | $20,330 | $40,120 |
| 2022 | $2,740 | $60,450 | $20,330 | $40,120 |
| 2021 | $3,823 | $60,450 | $20,330 | $40,120 |
| 2020 | $3,001 | $41,080 | $12,770 | $28,310 |
| 2019 | $2,874 | $41,080 | $12,770 | $28,310 |
| 2018 | $2,839 | $41,080 | $0 | $0 |
| 2017 | $2,787 | $41,080 | $0 | $0 |
| 2016 | $225 | $41,080 | $0 | $0 |
| 2015 | $225 | $41,080 | $0 | $0 |
| 2014 | $225 | $41,080 | $0 | $0 |
Source: Public Records
Map
Nearby Homes
- 118 N 2nd St
- 306 Berbro St
- 323 Berbro St
- 101 Greenway Ave
- 9 Greenway Ave
- 1 Greenway Ave
- 213 Main St
- 22 N Front St
- 3 Greenway Ave
- 5 Greenway Ave
- 9 N Front St
- 16 Greenway Ave
- 210 Londonderry Ln
- 422 Darby Terrance Terrace
- 443 Darby Terrace
- 25 S Front St
- 200 N 6th St
- 2205-7 Island Rd
- 214 N 6th St
- 211 Wright Ave