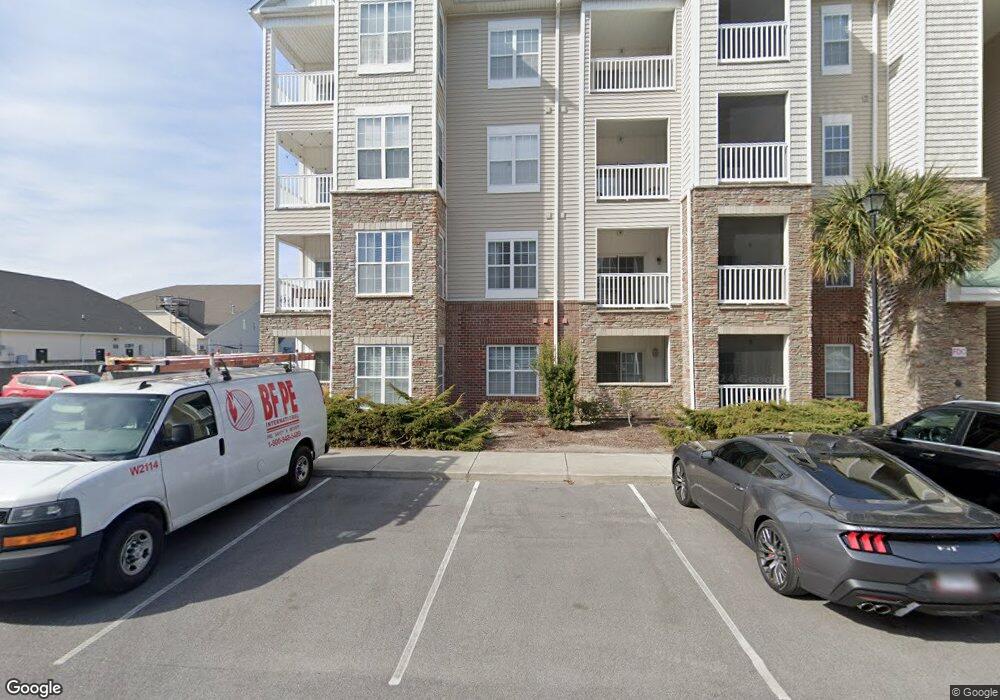
200 Gateway Condos Dr Unit 222 Holly Ridge, NC 28445
Estimated Value: $262,000 - $335,000
2
Beds
2
Baths
1,027
Sq Ft
$280/Sq Ft
Est. Value
About This Home
This home is located at 200 Gateway Condos Dr Unit 222, Holly Ridge, NC 28445 and is currently estimated at $287,084, approximately $279 per square foot. 200 Gateway Condos Dr Unit 222 is a home located in Pender County with nearby schools including North Topsail Elementary School, Topsail Middle School, and Topsail High School.
Ownership History
Date
Name
Owned For
Owner Type
Purchase Details
Closed on
Jan 24, 2024
Sold by
Florio Thomas and Florio Desiree
Bought by
Powell Judith Rowland
Current Estimated Value
Home Financials for this Owner
Home Financials are based on the most recent Mortgage that was taken out on this home.
Original Mortgage
$252,000
Outstanding Balance
$245,698
Interest Rate
5%
Mortgage Type
New Conventional
Estimated Equity
$41,386
Purchase Details
Closed on
Jun 15, 2023
Sold by
Byrd Lisa A
Bought by
Florio Thomas and Florio Desiree
Purchase Details
Closed on
Jun 15, 2011
Sold by
Surf City Condominiums Llc
Bought by
Byrd Lisa A
Home Financials for this Owner
Home Financials are based on the most recent Mortgage that was taken out on this home.
Original Mortgage
$129,400
Interest Rate
4.75%
Mortgage Type
Adjustable Rate Mortgage/ARM
Create a Home Valuation Report for This Property
The Home Valuation Report is an in-depth analysis detailing your home's value as well as a comparison with similar homes in the area
Home Values in the Area
Average Home Value in this Area
Purchase History
| Date | Buyer | Sale Price | Title Company |
|---|---|---|---|
| Powell Judith Rowland | $280,000 | None Listed On Document | |
| Powell Judith Rowland | $280,000 | None Listed On Document | |
| Florio Thomas | $180,000 | None Listed On Document | |
| Byrd Lisa A | $134,500 | -- |
Source: Public Records
Mortgage History
| Date | Status | Borrower | Loan Amount |
|---|---|---|---|
| Open | Powell Judith Rowland | $252,000 | |
| Closed | Powell Judith Rowland | $252,000 | |
| Previous Owner | Byrd Lisa A | $129,400 |
Source: Public Records
Tax History Compared to Growth
Tax History
| Year | Tax Paid | Tax Assessment Tax Assessment Total Assessment is a certain percentage of the fair market value that is determined by local assessors to be the total taxable value of land and additions on the property. | Land | Improvement |
|---|---|---|---|---|
| 2024 | $1,027 | $123,726 | $0 | $123,726 |
| 2023 | $1,027 | $123,726 | $0 | $123,726 |
| 2022 | $912 | $123,726 | $0 | $123,726 |
| 2021 | $912 | $123,726 | $0 | $123,726 |
| 2020 | $912 | $123,726 | $0 | $123,726 |
| 2019 | $912 | $123,726 | $0 | $123,726 |
| 2018 | $828 | $106,538 | $0 | $106,538 |
| 2017 | $828 | $106,538 | $0 | $106,538 |
| 2016 | $818 | $106,538 | $0 | $106,538 |
| 2015 | $1,024 | $106,538 | $0 | $106,538 |
| 2014 | $780 | $133,475 | $0 | $133,475 |
| 2013 | -- | $133,475 | $0 | $133,475 |
| 2012 | -- | $133,475 | $0 | $133,475 |
Source: Public Records
Map
Nearby Homes
- 200 Gateway Condos Dr Unit 225
- 200 Gateway Condos Dr Unit 214
- 200 Gateway Condos Dr Unit 243
- 119 S Grassland Rd Unit Th 39
- 117 S Grassland Rd Unit 40
- 111 S Grassland Rd
- 111 S Grassland Rd Unit 43
- 107 S Grassland Rd Unit 45
- 103 S Grassland Rd Unit Th 47
- 103 S Grassland Rd Unit 47
- 108 S Grassland Rd Unit 30
- 105 S Grassland Rd Unit 46
- 102 S Grassland Rd Unit Lot 27
- 104 N Grassland Rd Unit Th 23
- 110 N Grassland Rd Unit Th20
- 100 N Grassland Rd Unit Th 25
- 106 N Grassland Rd Unit Th 22
- 106 S Grassland Rd Unit Th29
- 106 S Grassland Rd Unit Th Lot 29
- 106 S Grassland Rd Unit 29
- 200 Gateway Condos Dr Unit 230
- 200 Gateway Condos Dr Unit 215
- 200 Gateway Condos Dr Unit 236
- 200 Gateway Condos Dr Unit 224
- 200 Gateway Condos Dr Unit 211
- 200 Gateway Condos Dr Unit 232
- 200 Gateway Condos Dr
- 200 Gateway Condos Dr Unit 240
- 200 Gateway Condos Dr Unit 231
- 200 Gateway Condos Dr Unit 216
- 226 Gateway Condos Dr Unit 226
- 200 Gateway Condos Dr Unit 244
- 200 Gateway Condos Dr Unit 236
- 200 Gateway Condos Dr Unit 234
- 200 Gateway Condos Dr Unit 215
- 200 Gateway Condos Dr Unit 211
- 200 Gateway Condos Dr Unit 245
- 200 Gateway Condos Dr Unit 222
- 200 Gateway Condos Dr Unit 233
- 200 Gateway Condos Dr Unit 231