200 Glen Way Unit 10A Incline Village, NV 89451
Estimated Value: $4,274,000 - $4,530,129
4
Beds
5
Baths
4,414
Sq Ft
$1,007/Sq Ft
Est. Value
About This Home
This home is located at 200 Glen Way Unit 10A, Incline Village, NV 89451 and is currently estimated at $4,444,376, approximately $1,006 per square foot. 200 Glen Way Unit 10A is a home located in Washoe County with nearby schools including Incline Elementary School, Incline Middle School, and Incline High School.
Ownership History
Date
Name
Owned For
Owner Type
Purchase Details
Closed on
Aug 12, 2019
Sold by
Zahler Paul
Bought by
Spitzer Jeffrey J and Spitzer Lynn
Current Estimated Value
Purchase Details
Closed on
Mar 31, 2010
Sold by
Zahler Paul and Zahler Mary Pat
Bought by
Spitzer Jeffrey J and Spitzer Lynn
Purchase Details
Closed on
Jan 30, 2007
Sold by
Zahler Paul C
Bought by
Zahler Paul and Zahler Mary Pat
Home Financials for this Owner
Home Financials are based on the most recent Mortgage that was taken out on this home.
Original Mortgage
$1,500,000
Interest Rate
6.25%
Mortgage Type
Unknown
Purchase Details
Closed on
Jan 10, 2007
Sold by
Zahler Mary Pat
Bought by
Zahler Paul C
Home Financials for this Owner
Home Financials are based on the most recent Mortgage that was taken out on this home.
Original Mortgage
$1,500,000
Interest Rate
6.25%
Mortgage Type
Unknown
Create a Home Valuation Report for This Property
The Home Valuation Report is an in-depth analysis detailing your home's value as well as a comparison with similar homes in the area
Home Values in the Area
Average Home Value in this Area
Purchase History
| Date | Buyer | Sale Price | Title Company |
|---|---|---|---|
| Spitzer Jeffrey J | -- | First American Title Ins Co | |
| Spitzer Jeffrey J | $1,750,000 | First American Title Iv | |
| Zahler Paul | -- | First American Title | |
| Zahler Paul C | -- | First American Title | |
| Zahler Paul C | $2,500,000 | First American Title |
Source: Public Records
Mortgage History
| Date | Status | Borrower | Loan Amount |
|---|---|---|---|
| Previous Owner | Zahler Paul C | $1,500,000 |
Source: Public Records
Tax History Compared to Growth
Tax History
| Year | Tax Paid | Tax Assessment Tax Assessment Total Assessment is a certain percentage of the fair market value that is determined by local assessors to be the total taxable value of land and additions on the property. | Land | Improvement |
|---|---|---|---|---|
| 2025 | $23,226 | $728,969 | $192,395 | $536,574 |
| 2024 | $23,226 | $723,276 | $183,225 | $540,051 |
| 2023 | $22,569 | $709,645 | $199,150 | $510,495 |
| 2022 | $22,250 | $617,278 | $165,970 | $451,308 |
| 2021 | $21,994 | $609,356 | $165,970 | $443,386 |
| 2020 | $21,483 | $603,693 | $165,970 | $437,723 |
| 2019 | $20,882 | $605,715 | $165,970 | $439,745 |
| 2018 | $20,298 | $595,601 | $148,190 | $447,411 |
| 2017 | $19,731 | $577,844 | $132,300 | $445,544 |
| 2016 | $19,252 | $569,230 | $117,705 | $451,525 |
| 2015 | $19,215 | $559,521 | $106,330 | $453,191 |
| 2014 | $18,679 | $518,120 | $96,880 | $421,240 |
| 2013 | -- | $518,071 | $89,110 | $428,961 |
Source: Public Records
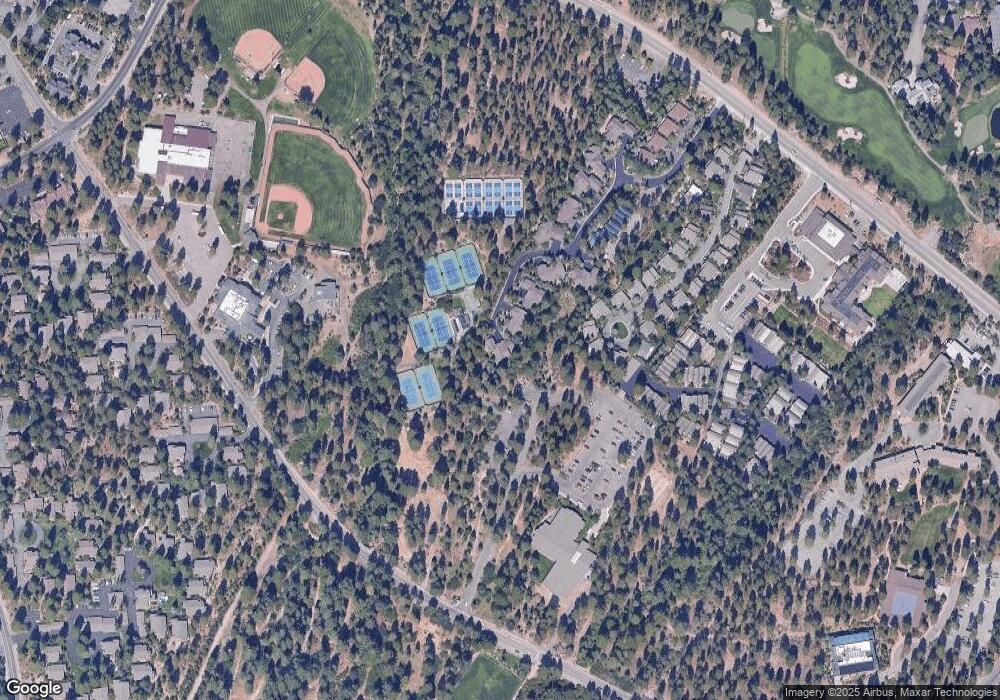
Map
Nearby Homes
- 989 Tahoe Blvd Unit 61
- 989 Tahoe Blvd Unit 71
- 989 Tahoe Blvd Unit 77
- 989 Tahoe Blvd Unit 36
- 989 Tahoe Blvd Unit 91
- 939 Incline Way Unit 195
- 120 Village Blvd Unit 152
- 931 Incline Way Unit 249
- 144 Village Blvd Unit 96
- 144 Village Blvd Unit 35
- 144 Village Blvd Unit 51
- 929 Southwood Blvd Unit 11
- 929 Southwood Blvd
- 929 Southwood Blvd Unit 23
- 981 4th Green Dr
- 948 Northwood Blvd
- 960 4th Green Dr
- 947 Tahoe Blvd Unit 206
- 170 Village Blvd Unit 4
- 198 Country Club Dr Unit 35
- 210 Glen Way Unit 9
- 210 Glen Way
- 220 Glen Way Unit 8
- 220 Glen Way
- 257 Deer Ct
- 230 Glen Way Unit 7
- 230 Glen Way
- 253 Deer Ct Unit 13
- 259 Deer Ct
- 240 Glen Way Unit 6
- 240 Glen Way Unit 6A
- 254 Deer Ct
- 255 Glen Way Unit 5
- 261 Deer Ct
- 258 Deer Ct
- 265 Deer Ct Unit 17
- 262 Deer Ct Unit 10
- 989 NE Tahoe Blvd Tahoe Racquet Unit 85
- 265 Glen Way
- 269 Deer Ct Unit 18