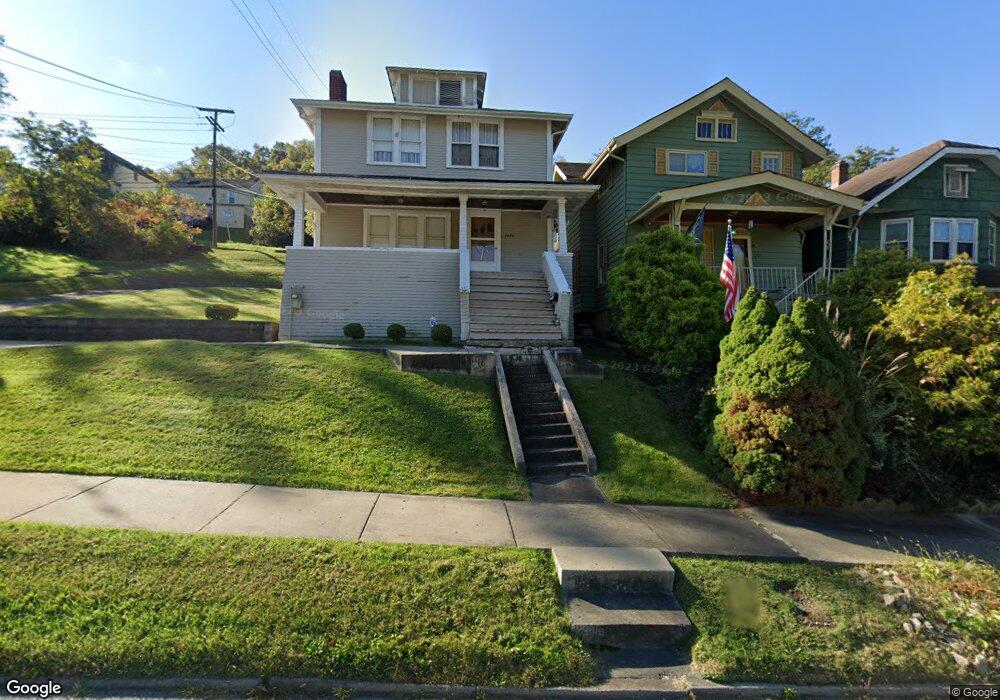
200 Green St Bridgeport, OH 43912
Estimated Value: $68,000 - $129,000
3
Beds
1
Bath
1,498
Sq Ft
$70/Sq Ft
Est. Value
About This Home
This home is located at 200 Green St, Bridgeport, OH 43912 and is currently estimated at $105,333, approximately $70 per square foot. 200 Green St is a home located in Belmont County with nearby schools including Bridgeport Elementary School, Bridgeport Middle School, and Bridgeport High School.
Ownership History
Date
Name
Owned For
Owner Type
Purchase Details
Closed on
Aug 29, 2017
Sold by
Duplaga Stanley T and Duplaga Sharon Kay
Bought by
Duplaga Realty Llc
Current Estimated Value
Purchase Details
Closed on
Sep 23, 2010
Sold by
Massey Shawn E and Massey Diane M
Bought by
Duplaga Stanley T
Home Financials for this Owner
Home Financials are based on the most recent Mortgage that was taken out on this home.
Original Mortgage
$14,000
Outstanding Balance
$9,140
Interest Rate
4.45%
Mortgage Type
Seller Take Back
Estimated Equity
$96,193
Purchase Details
Closed on
Feb 26, 2010
Sold by
Lewis Richard M and Lewis Lynda J
Bought by
Massey Shawn E and Massey Diane M
Purchase Details
Closed on
Jan 14, 2005
Sold by
Hicks Mary Louise
Bought by
Lewis Richard M and Lewis Lynda J
Purchase Details
Closed on
Jan 1, 1986
Sold by
Hicks Mary Louise
Bought by
Hicks Mary Louise
Create a Home Valuation Report for This Property
The Home Valuation Report is an in-depth analysis detailing your home's value as well as a comparison with similar homes in the area
Purchase History
| Date | Buyer | Sale Price | Title Company |
|---|---|---|---|
| Duplaga Realty Llc | -- | Attorney | |
| Duplaga Stanley T | $25,000 | Attorney | |
| Massey Shawn E | $10,000 | Attorney | |
| Lewis Richard M | -- | None Available | |
| Hicks Mary Louise | -- | -- |
Source: Public Records
Mortgage History
| Date | Status | Borrower | Loan Amount |
|---|---|---|---|
| Open | Duplaga Stanley T | $14,000 |
Source: Public Records
Tax History
| Year | Tax Paid | Tax Assessment Tax Assessment Total Assessment is a certain percentage of the fair market value that is determined by local assessors to be the total taxable value of land and additions on the property. | Land | Improvement |
|---|---|---|---|---|
| 2025 | $1,586 | $31,200 | $2,660 | $28,540 |
| 2024 | $1,294 | $31,200 | $2,660 | $28,540 |
| 2023 | $1,251 | $13,800 | $2,670 | $11,130 |
| 2022 | $611 | $13,796 | $2,670 | $11,126 |
| 2021 | $608 | $13,796 | $2,670 | $11,126 |
| 2020 | $498 | $11,500 | $2,230 | $9,270 |
| 2019 | $500 | $11,500 | $2,230 | $9,270 |
| 2018 | $472 | $11,500 | $2,230 | $9,270 |
| 2017 | $432 | $9,000 | $2,100 | $6,900 |
| 2016 | $437 | $9,000 | $2,100 | $6,900 |
| 2015 | $457 | $9,000 | $2,100 | $6,900 |
| 2014 | $522 | $10,020 | $1,910 | $8,110 |
| 2013 | $528 | $10,020 | $1,910 | $8,110 |
Source: Public Records
Map
Nearby Homes
- 806 Howard St
- 609 Whitely St
- 822 W Bennett St
- 422 Whitely St
- 413 Bennett St
- 44 Mann St
- 308 Whitely St
- 1049 Buckeye St
- 219 Whitely St
- 836 Main St
- 225 Jacquette St
- 244 Lombardy Heights
- 67478 Kirkwood Heights Rd
- 67457 Kirkwood Heights Rd
- 67471 Kirkwood Heights Rd
- 67540 Kirkwood Heights Rd
- TBD Alexander Rd
- 67730 Kirkwood Heights Rd
- 4 Walnut Ave
- 0 Ohio 7
Your Personal Tour Guide
Ask me questions while you tour the home.