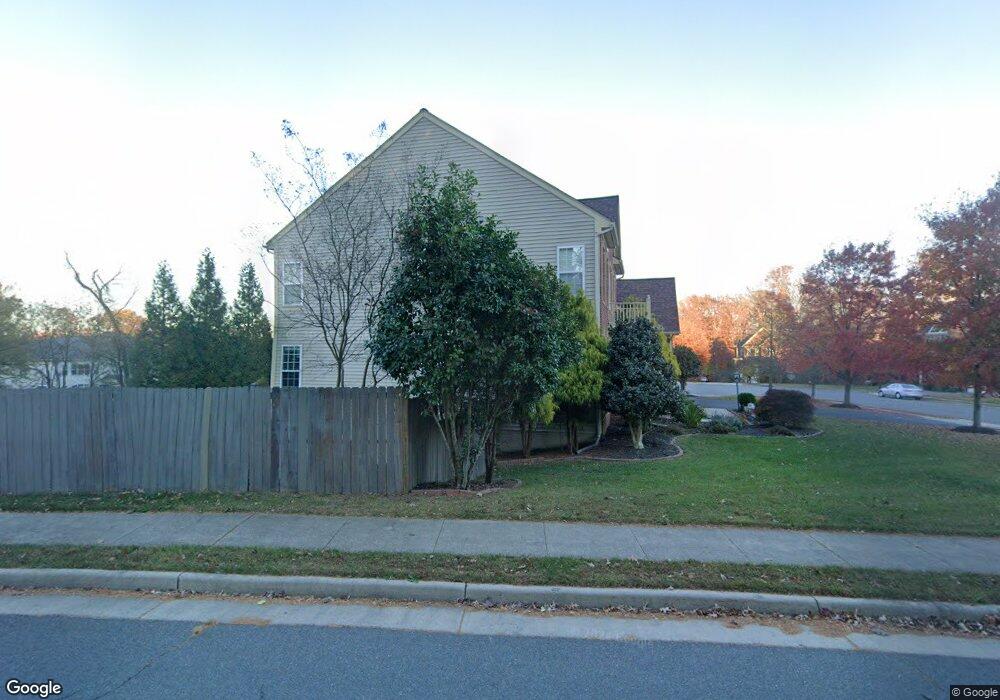
200 Greenhow Ct SE Leesburg, VA 20175
Estimated Value: $1,081,033 - $1,311,000
4
Beds
5
Baths
4,032
Sq Ft
$291/Sq Ft
Est. Value
About This Home
This home is located at 200 Greenhow Ct SE, Leesburg, VA 20175 and is currently estimated at $1,171,758, approximately $290 per square foot. 200 Greenhow Ct SE is a home located in Loudoun County with nearby schools including Cool Spring Elementary School, Harper Park Middle School, and Heritage High School.
Ownership History
Date
Name
Owned For
Owner Type
Purchase Details
Closed on
May 1, 2006
Sold by
Overlookk Beauregard
Bought by
Achar Ravi
Current Estimated Value
Home Financials for this Owner
Home Financials are based on the most recent Mortgage that was taken out on this home.
Original Mortgage
$662,500
Outstanding Balance
$383,692
Interest Rate
6.4%
Mortgage Type
New Conventional
Estimated Equity
$788,066
Create a Home Valuation Report for This Property
The Home Valuation Report is an in-depth analysis detailing your home's value as well as a comparison with similar homes in the area
Home Values in the Area
Average Home Value in this Area
Purchase History
| Date | Buyer | Sale Price | Title Company |
|---|---|---|---|
| Achar Ravi | $869,015 | -- |
Source: Public Records
Mortgage History
| Date | Status | Borrower | Loan Amount |
|---|---|---|---|
| Open | Achar Ravi | $662,500 |
Source: Public Records
Tax History Compared to Growth
Tax History
| Year | Tax Paid | Tax Assessment Tax Assessment Total Assessment is a certain percentage of the fair market value that is determined by local assessors to be the total taxable value of land and additions on the property. | Land | Improvement |
|---|---|---|---|---|
| 2025 | $8,436 | $1,048,010 | $324,800 | $723,210 |
| 2024 | $8,354 | $965,770 | $299,800 | $665,970 |
| 2023 | $7,943 | $907,720 | $299,800 | $607,920 |
| 2022 | $8,165 | $917,390 | $257,300 | $660,090 |
| 2021 | $7,805 | $796,430 | $202,300 | $594,130 |
| 2020 | $7,063 | $682,430 | $182,300 | $500,130 |
| 2019 | $6,881 | $658,490 | $182,300 | $476,190 |
| 2018 | $7,149 | $658,910 | $182,300 | $476,610 |
| 2017 | $7,134 | $634,170 | $182,300 | $451,870 |
| 2016 | $7,264 | $634,440 | $0 | $0 |
| 2015 | $1,203 | $475,160 | $0 | $475,160 |
| 2014 | $1,142 | $450,450 | $0 | $450,450 |
Source: Public Records
Map
Nearby Homes
- 1005 Venifena Terrace SE
- 1007 Venifena Terrace SE
- 1009 Venifena Terrace SE
- 235 Chianti Terrace SE
- 1021 Venifena Terrace SE
- 229 Chianti Terrace SE
- 219 Chianti Terrace SE
- 222 Chianti Terrace SE
- 218 Chianti Terrace SE
- 1039 Inferno Terrace SE
- 1035 Inferno Terrace SE
- 1031 Inferno Terrace SE
- 1023 Inferno Terrace SE
- 1021 Inferno Terrace SE
- 1013 Inferno Terrace SE
- 1005 Inferno Terrace SE
- 1003 Inferno Terrace SE
- 302 Bodega Terrace SE
- The Savannah Plan at Tuscarora Village
- 308 Nebeiolo Terrace SE
- 202 Greenhow Ct SE
- 103 Calvary Ct SE
- 141 Lawson Rd SE
- 201 Greenhow Ct SE
- 105 Calvary Ct SE
- 101 Calvary Ct SE
- 204 Greenhow Ct SE
- 107 Calvary Ct SE
- 203 Greenhow Ct SE
- 206 Lawson Rd SE
- 103 Generals Ct SE
- 205 Greenhow Ct SE
- 108 Calvary Ct SE
- 102 Calvary Ct SE
- 204 Lawson Rd SE
- 151 Lawson Rd SE
- 100 Calvary Ct SE
- 17 S Colonels Ln
- 104 Calvary Ct SE
- 106 Calvary Ct SE