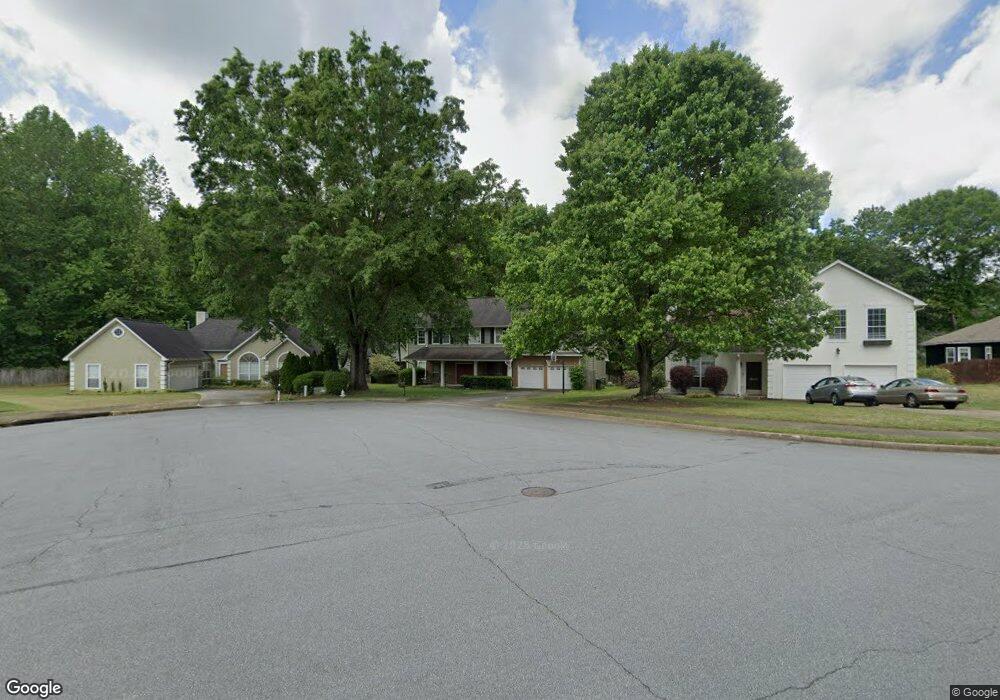
200 Greenmont Cir Alpharetta, GA 30009
Estimated Value: $613,000 - $711,000
4
Beds
3
Baths
2,777
Sq Ft
$235/Sq Ft
Est. Value
About This Home
This home is located at 200 Greenmont Cir, Alpharetta, GA 30009 and is currently estimated at $652,089, approximately $234 per square foot. 200 Greenmont Cir is a home located in Fulton County with nearby schools including Alpharetta Elementary School, Northwestern Middle School, and Milton High School.
Ownership History
Date
Name
Owned For
Owner Type
Purchase Details
Closed on
Aug 26, 2019
Sold by
Cross Michael D
Bought by
Skidd Laurie A
Current Estimated Value
Purchase Details
Closed on
May 23, 2008
Sold by
Turner E Allen and Turner Sharon L
Bought by
Cross Michael D and Cross Laurie S
Home Financials for this Owner
Home Financials are based on the most recent Mortgage that was taken out on this home.
Original Mortgage
$257,925
Interest Rate
5.86%
Mortgage Type
New Conventional
Purchase Details
Closed on
Sep 10, 1997
Sold by
Tipton Mary D
Bought by
Turner E Allen and Turner Sharon
Home Financials for this Owner
Home Financials are based on the most recent Mortgage that was taken out on this home.
Original Mortgage
$122,400
Interest Rate
6.62%
Mortgage Type
New Conventional
Create a Home Valuation Report for This Property
The Home Valuation Report is an in-depth analysis detailing your home's value as well as a comparison with similar homes in the area
Home Values in the Area
Average Home Value in this Area
Purchase History
| Date | Buyer | Sale Price | Title Company |
|---|---|---|---|
| Skidd Laurie A | -- | -- | |
| Cross Michael D | $271,500 | -- | |
| Turner E Allen | $153,000 | -- |
Source: Public Records
Mortgage History
| Date | Status | Borrower | Loan Amount |
|---|---|---|---|
| Previous Owner | Cross Michael D | $257,925 | |
| Previous Owner | Turner E Allen | $122,400 |
Source: Public Records
Tax History Compared to Growth
Tax History
| Year | Tax Paid | Tax Assessment Tax Assessment Total Assessment is a certain percentage of the fair market value that is determined by local assessors to be the total taxable value of land and additions on the property. | Land | Improvement |
|---|---|---|---|---|
| 2025 | $1,003 | $228,480 | $49,000 | $179,480 |
| 2023 | $5,792 | $205,200 | $42,400 | $162,800 |
| 2022 | $4,840 | $183,960 | $31,120 | $152,840 |
| 2021 | $5,235 | $159,200 | $23,360 | $135,840 |
| 2020 | $5,137 | $153,160 | $25,720 | $127,440 |
| 2019 | $374 | $150,480 | $25,280 | $125,200 |
| 2018 | $3,049 | $139,960 | $23,160 | $116,800 |
| 2017 | $2,481 | $85,040 | $15,480 | $69,560 |
| 2016 | $2,482 | $85,040 | $15,480 | $69,560 |
| 2015 | $2,981 | $85,040 | $15,480 | $69,560 |
| 2014 | $2,607 | $85,040 | $15,480 | $69,560 |
Source: Public Records
Map
Nearby Homes
- 116 Emily Ln
- 1510 Shade Tree Way
- 170 Michaela Dr
- 1530 Rucker Rd
- 1413 Bellsmith Dr
- 1614 Rucker Rd
- 3052 Steeplechase
- 1386 Bellsmith Dr
- 3058 Steeplechase Unit 4
- 1395 Mid Broadwell Rd
- 160 Watermill Falls
- 3018 Steeplechase
- 3016 Steeplechase Unit 3
- 1110 Upper Hembree Rd
- 1500 Mid Broadwell Rd
- 165 Foe Creek Ct
- Hillstone with Basement Plan at Emberly - Monarch Collection
- 145 Greenmont Cir Unit C
- 190 Greenmont Cir Unit 1
- 220 Greenmont Cir
- 745 Paddock Ct
- 180 Greenmont Cir Unit 1
- 730 Paddock Ct
- 0 Paddock Ct Unit 7223080
- 0 Paddock Ct
- 735 Paddock Ct
- 170 Greenmont Cir Unit 1
- 230 Greenmont Cir Unit 2
- 165 Greenmont Cir Unit 1
- 725 Paddock Ct
- 155 Greenmont Cir
- 160 Greenmont Cir
- 240 Greenmont Cir
- 720 Paddock Ct
- 2135 Fairfax Dr
- 2145 Fairfax Dr
- 215 Greenmont Downs Ln