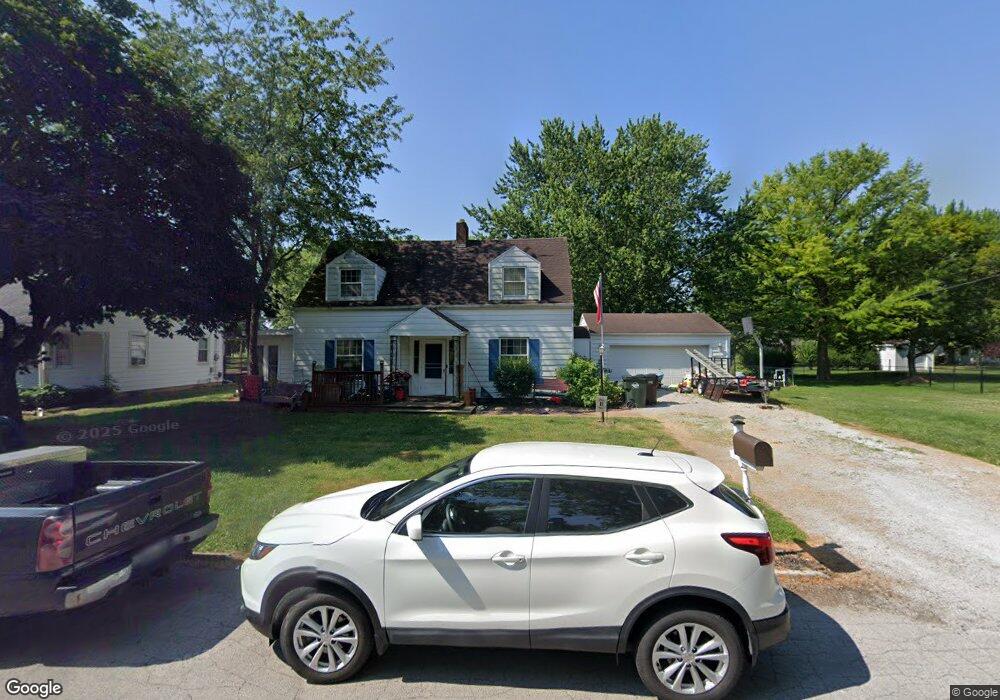
200 Gross St Tiffin, OH 44883
Estimated Value: $171,381 - $194,000
3
Beds
2
Baths
1,700
Sq Ft
$109/Sq Ft
Est. Value
About This Home
This home is located at 200 Gross St, Tiffin, OH 44883 and is currently estimated at $184,845, approximately $108 per square foot. 200 Gross St is a home located in Seneca County with nearby schools including Columbian High School, Bridges Community Academy, and Calvert High School.
Ownership History
Date
Name
Owned For
Owner Type
Purchase Details
Closed on
May 29, 2008
Sold by
Schank Jeffrey A
Bought by
Schank Wendy B Borer
Current Estimated Value
Purchase Details
Closed on
Mar 21, 2005
Sold by
Fretz John A
Bought by
Schank Jeffrey A and Borer Schank Wendy B
Home Financials for this Owner
Home Financials are based on the most recent Mortgage that was taken out on this home.
Original Mortgage
$98,000
Outstanding Balance
$49,782
Interest Rate
5.64%
Mortgage Type
New Conventional
Estimated Equity
$135,063
Purchase Details
Closed on
Dec 29, 2003
Sold by
Gruss Patricia A
Bought by
Fretz John A
Purchase Details
Closed on
Jun 1, 1987
Create a Home Valuation Report for This Property
The Home Valuation Report is an in-depth analysis detailing your home's value as well as a comparison with similar homes in the area
Home Values in the Area
Average Home Value in this Area
Purchase History
| Date | Buyer | Sale Price | Title Company |
|---|---|---|---|
| Schank Wendy B Borer | -- | None Available | |
| Schank Jeffrey A | $106,700 | None Available | |
| Fretz John A | $106,500 | -- | |
| -- | $51,000 | -- |
Source: Public Records
Mortgage History
| Date | Status | Borrower | Loan Amount |
|---|---|---|---|
| Open | Schank Jeffrey A | $98,000 |
Source: Public Records
Tax History Compared to Growth
Tax History
| Year | Tax Paid | Tax Assessment Tax Assessment Total Assessment is a certain percentage of the fair market value that is determined by local assessors to be the total taxable value of land and additions on the property. | Land | Improvement |
|---|---|---|---|---|
| 2024 | $1,871 | $45,310 | $6,190 | $39,120 |
| 2023 | $2,035 | $45,310 | $6,190 | $39,120 |
| 2022 | $2,014 | $45,400 | $5,820 | $39,580 |
| 2021 | $2,111 | $45,400 | $5,820 | $39,580 |
| 2020 | $1,999 | $45,406 | $5,824 | $39,582 |
| 2019 | $1,956 | $39,197 | $5,159 | $34,038 |
| 2018 | $1,696 | $39,197 | $5,159 | $34,038 |
| 2017 | $1,610 | $39,197 | $5,159 | $34,038 |
| 2016 | $1,523 | $35,693 | $5,005 | $30,688 |
| 2015 | $1,852 | $35,693 | $5,005 | $30,688 |
| 2014 | $1,418 | $35,693 | $5,005 | $30,688 |
| 2013 | $1,703 | $36,799 | $5,159 | $31,640 |
Source: Public Records
Map
Nearby Homes