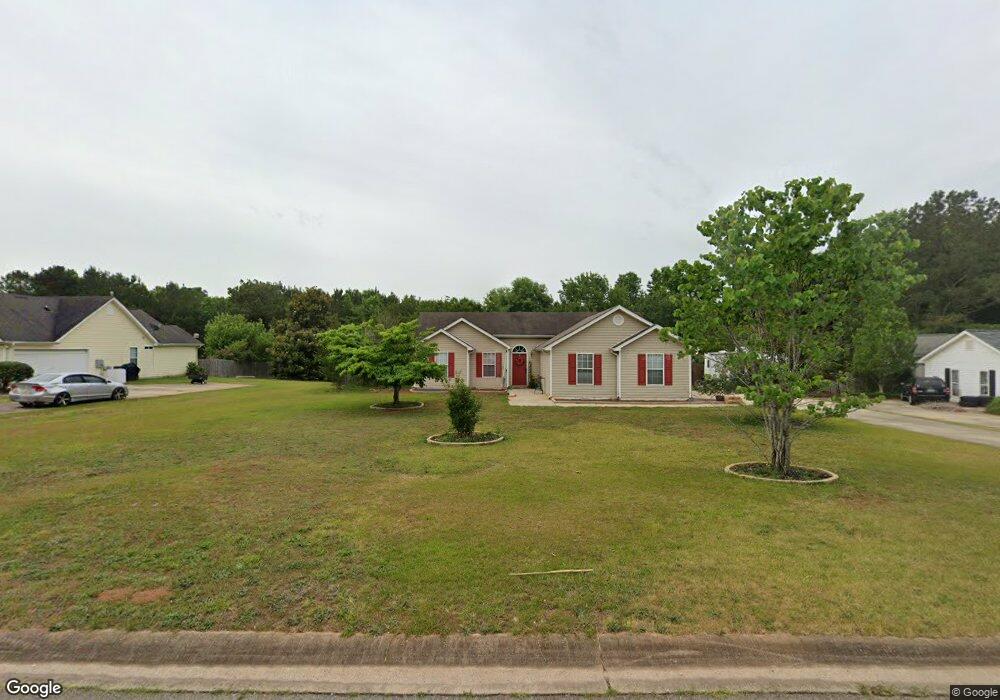
200 Hayward Bishop Way Senoia, GA 30276
Estimated Value: $278,723 - $329,000
3
Beds
2
Baths
1,162
Sq Ft
$264/Sq Ft
Est. Value
About This Home
This home is located at 200 Hayward Bishop Way, Senoia, GA 30276 and is currently estimated at $306,431, approximately $263 per square foot. 200 Hayward Bishop Way is a home located in Coweta County with nearby schools including Poplar Road Elementary School, East Coweta Middle School, and East Coweta High School.
Ownership History
Date
Name
Owned For
Owner Type
Purchase Details
Closed on
Apr 30, 2004
Sold by
Sibley Jeffrey W and Sibley Natalie J
Bought by
Flessinger Alison L and Flessinger Gilbert
Current Estimated Value
Home Financials for this Owner
Home Financials are based on the most recent Mortgage that was taken out on this home.
Original Mortgage
$123,322
Outstanding Balance
$57,250
Interest Rate
5.36%
Mortgage Type
VA
Estimated Equity
$249,181
Purchase Details
Closed on
Apr 24, 2000
Sold by
David Lindsey Homes Inc
Bought by
Sibley Jeffrey W and Sibley Natalie J
Home Financials for this Owner
Home Financials are based on the most recent Mortgage that was taken out on this home.
Original Mortgage
$102,045
Interest Rate
8.24%
Mortgage Type
FHA
Purchase Details
Closed on
Jul 22, 1998
Bought by
David Lindsey Homes
Create a Home Valuation Report for This Property
The Home Valuation Report is an in-depth analysis detailing your home's value as well as a comparison with similar homes in the area
Home Values in the Area
Average Home Value in this Area
Purchase History
| Date | Buyer | Sale Price | Title Company |
|---|---|---|---|
| Flessinger Alison L | $124,600 | -- | |
| Sibley Jeffrey W | $102,900 | -- | |
| David Lindsey Homes | $577,500 | -- |
Source: Public Records
Mortgage History
| Date | Status | Borrower | Loan Amount |
|---|---|---|---|
| Open | Flessinger Alison L | $123,322 | |
| Previous Owner | Sibley Jeffrey W | $102,045 |
Source: Public Records
Tax History Compared to Growth
Tax History
| Year | Tax Paid | Tax Assessment Tax Assessment Total Assessment is a certain percentage of the fair market value that is determined by local assessors to be the total taxable value of land and additions on the property. | Land | Improvement |
|---|---|---|---|---|
| 2024 | $2,219 | $100,200 | $24,000 | $76,200 |
| 2023 | $2,219 | $90,883 | $20,000 | $70,883 |
| 2022 | $1,851 | $79,837 | $20,000 | $59,837 |
| 2021 | $1,638 | $66,880 | $16,000 | $50,880 |
| 2020 | $1,544 | $62,970 | $16,000 | $46,970 |
| 2019 | $1,398 | $52,565 | $10,000 | $42,565 |
| 2018 | $1,401 | $52,565 | $10,000 | $42,565 |
| 2017 | $1,294 | $48,917 | $10,000 | $38,917 |
| 2016 | $1,201 | $46,180 | $10,000 | $36,180 |
| 2015 | $1,105 | $43,444 | $10,000 | $33,444 |
| 2014 | $802 | $38,404 | $8,000 | $30,404 |
Source: Public Records
Map
Nearby Homes
- 525 Hayward Bishop Way
- 25 Peeks Ct
- 909 Lawshe Rd
- 95 Old Mill Way Unit 2
- 135 Old Mill Way Unit 4
- 752 Lawshe Rd
- 1907 Standing Rock Rd
- 40 Owens Path
- 2022 Standing Rock Rd
- 15 Fieldstone Farms Dr
- 130 Putney Way
- 7 Belvoir Place
- 2000 Elders Mill Rd
- 32 Wrightsburg Trail
- 129 Rutland Ct
- 107 Barnsley Farms Dr
- 45 Cushing St Unit 156
- 350 Cushing St
- 300 Kenwood Trail
- 275 Kenwood Trail
- 190 Hayward Bishop Way
- 210 Hayward Bishop Way
- 180 Hayward Bishop Way Unit E18
- 180 Hayward Bishop Way
- 180 Hayward Bishop Way
- 220 Hayward Bishop Way
- 205 Hayward Bishop Way
- 600 Hayward Bishop Way
- 195 Hayward Bishop Way
- 590 Hayward Bishop Way
- 610 Hayward Bishop Way
- 215 Hayward Bishop Way
- 230 Hayward Bishop Way
- 170 Hayward Bishop Way
- 580 Hayward Bishop Way
- 620 Hayward Bishop Way
- 225 Hayward Bishop Way
- 240 Hayward Bishop Way
- 0 Hayward Bishop Way Unit 8638202
- 0 Hayward Bishop Way Unit 8631832