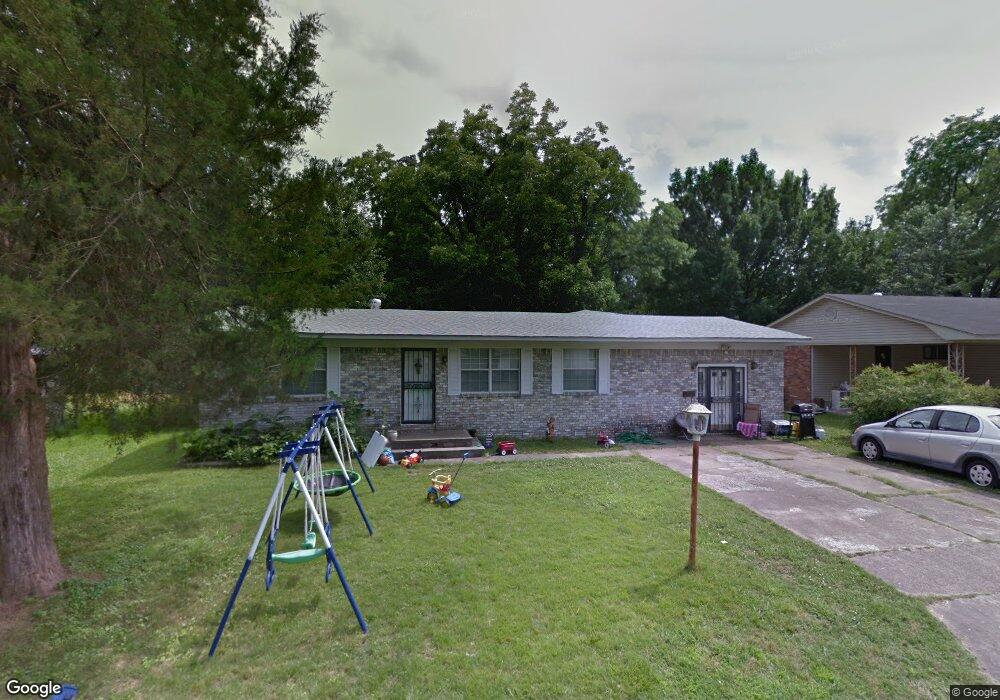
200 Hillwood Dr Sherwood, AR 72120
Estimated Value: $140,000 - $251,000
--
Bed
2
Baths
2,200
Sq Ft
$87/Sq Ft
Est. Value
About This Home
This home is located at 200 Hillwood Dr, Sherwood, AR 72120 and is currently estimated at $190,440, approximately $86 per square foot. 200 Hillwood Dr is a home located in Pulaski County with nearby schools including Sylvan Hills Elementary School, Sylvan Hills Middle School, and Sylvan Hills High School.
Ownership History
Date
Name
Owned For
Owner Type
Purchase Details
Closed on
Sep 3, 2003
Sold by
Sundeen Darlene
Bought by
Rehman Choudhry L and Rehman Mary C
Current Estimated Value
Home Financials for this Owner
Home Financials are based on the most recent Mortgage that was taken out on this home.
Original Mortgage
$91,000
Outstanding Balance
$41,904
Interest Rate
6.25%
Mortgage Type
Purchase Money Mortgage
Estimated Equity
$148,536
Purchase Details
Closed on
Aug 25, 2001
Sold by
Sundeen Darlene
Bought by
Rehman Choudhry and Rehman Mary
Purchase Details
Closed on
Feb 2, 2001
Sold by
Norman John Felton and Estate Of Hazel King Hicks
Bought by
Sundeen Darlene
Home Financials for this Owner
Home Financials are based on the most recent Mortgage that was taken out on this home.
Original Mortgage
$10,500
Interest Rate
7.04%
Mortgage Type
Purchase Money Mortgage
Create a Home Valuation Report for This Property
The Home Valuation Report is an in-depth analysis detailing your home's value as well as a comparison with similar homes in the area
Home Values in the Area
Average Home Value in this Area
Purchase History
| Date | Buyer | Sale Price | Title Company |
|---|---|---|---|
| Rehman Choudhry L | $60,000 | Transcontinental Title Co | |
| Rehman Choudhry | -- | -- | |
| Sundeen Darlene | $76,000 | -- |
Source: Public Records
Mortgage History
| Date | Status | Borrower | Loan Amount |
|---|---|---|---|
| Open | Rehman Choudhry L | $91,000 | |
| Previous Owner | Sundeen Darlene | $10,500 |
Source: Public Records
Tax History Compared to Growth
Tax History
| Year | Tax Paid | Tax Assessment Tax Assessment Total Assessment is a certain percentage of the fair market value that is determined by local assessors to be the total taxable value of land and additions on the property. | Land | Improvement |
|---|---|---|---|---|
| 2025 | $1,586 | $31,981 | $4,200 | $27,781 |
| 2024 | $1,454 | $31,981 | $4,200 | $27,781 |
| 2023 | $1,454 | $31,981 | $4,200 | $27,781 |
| 2022 | $1,561 | $31,981 | $4,200 | $27,781 |
| 2021 | $1,453 | $25,360 | $3,500 | $21,860 |
| 2020 | $1,071 | $25,360 | $3,500 | $21,860 |
| 2019 | $1,071 | $25,360 | $3,500 | $21,860 |
| 2018 | $1,096 | $25,360 | $3,500 | $21,860 |
| 2017 | $1,091 | $25,360 | $3,500 | $21,860 |
| 2016 | $1,053 | $24,620 | $3,800 | $20,820 |
| 2015 | $1,133 | $24,319 | $3,800 | $20,519 |
| 2014 | $1,133 | $22,299 | $3,800 | $18,499 |
Source: Public Records
Map
Nearby Homes
- 222 Gragson Ave
- 519 Hillcrest Rd
- 2520 Austin Oaks Dr
- 616 E Woodruff Ave
- 109 Pamela Ln
- 1909 Windridge Ct
- 14 Pamela Ln
- 59 Wesley Dr
- 9318 Woodbine Sttreet
- Lot 30 Hidden Creek Dr
- 9125 Woodbine St
- 3073 Woodruff Creek Dr
- 10732 Rocky Creek Dr
- 10724 Rocky Creek Dr
- 00 Highway 107
- 2949 Maelstrom Cir
- 25 Acres Denton Rd
- 9460 Robin Ln
- 2117 Ingleside Dr
- 1300 E Maryland Ave
- 214 Hillwood Dr
- 124 Hillwood Dr
- 206 Hillwood Dr
- 206 Elwood Dr
- 210 Hillwood Dr
- 9916 Highway 107
- 123 Hillwood Dr
- 207 Hillwood Dr
- 112 Hillwood Dr
- 218 Hillwood Dr
- 117 Hillwood Dr
- 211 Hillwood Dr
- 110 Elwood Dr
- 113 Hillwood Dr
- 219 Hillwood Dr
- 106 Hillwood Dr
- 224 Hillwood Dr
- 107 Hillwood Dr
- 223 Hillwood Dr
- 300 Hillwood Dr