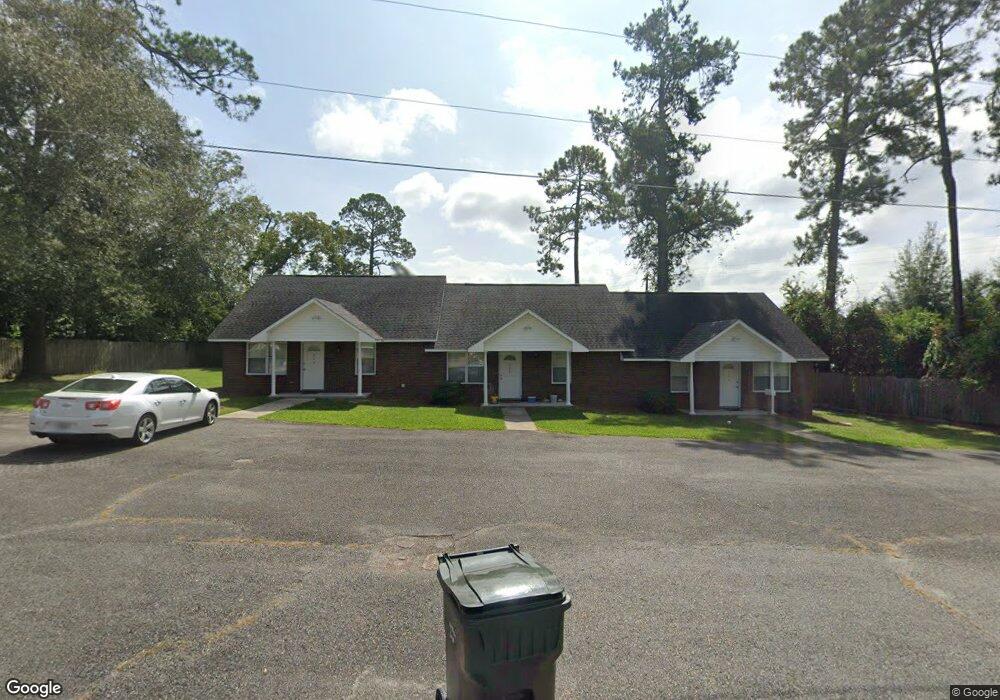
200 Holly St Waycross, GA 31501
Estimated Value: $238,000 - $305,000
6
Beds
3
Baths
2,604
Sq Ft
$100/Sq Ft
Est. Value
About This Home
This home is located at 200 Holly St, Waycross, GA 31501 and is currently estimated at $259,208, approximately $99 per square foot. 200 Holly St is a home located in Ware County with nearby schools including Williams Heights Elementary School, Waycross Middle School, and Ware County High School.
Ownership History
Date
Name
Owned For
Owner Type
Purchase Details
Closed on
May 10, 2021
Sold by
Stewart Wayne F
Bought by
Wsas Properties & Investments Llc
Current Estimated Value
Purchase Details
Closed on
Dec 18, 2017
Sold by
Stewart Wayne F
Bought by
Stewart Emma K
Purchase Details
Closed on
Dec 15, 2017
Sold by
Duane Railene B
Bought by
Stewart Wayne F
Purchase Details
Closed on
Aug 8, 2003
Sold by
Penn Phillip E
Bought by
Duane Lawrence J and Duane Railene B
Purchase Details
Closed on
Jan 13, 1999
Sold by
Blount Timothy E
Bought by
Penn Phillip E
Purchase Details
Closed on
Jun 4, 1997
Sold by
Howard Howard C and Howard Mi
Bought by
Blount Timothy E
Purchase Details
Closed on
Nov 7, 1996
Sold by
Williams B F Mrs
Bought by
Howard Howard C and Howard Mi
Create a Home Valuation Report for This Property
The Home Valuation Report is an in-depth analysis detailing your home's value as well as a comparison with similar homes in the area
Home Values in the Area
Average Home Value in this Area
Purchase History
| Date | Buyer | Sale Price | Title Company |
|---|---|---|---|
| Wsas Properties & Investments Llc | -- | -- | |
| Wsas Properties & Investments Llc | $130,000 | -- | |
| Stewart Emma K | -- | -- | |
| Stewart Wayne F | $167,500 | -- | |
| Duane Lawrence J | $125,000 | -- | |
| Penn Phillip E | $110,000 | -- | |
| Blount Timothy E | $115,000 | -- | |
| Howard Howard C | $7,500 | -- |
Source: Public Records
Tax History Compared to Growth
Tax History
| Year | Tax Paid | Tax Assessment Tax Assessment Total Assessment is a certain percentage of the fair market value that is determined by local assessors to be the total taxable value of land and additions on the property. | Land | Improvement |
|---|---|---|---|---|
| 2024 | $2,530 | $115,132 | $6,880 | $108,252 |
| 2023 | $2,582 | $70,831 | $5,393 | $65,438 |
| 2022 | $2,399 | $64,487 | $5,393 | $59,094 |
| 2021 | $2,569 | $59,410 | $5,393 | $54,017 |
| 2020 | $2,629 | $61,533 | $5,393 | $56,140 |
| 2019 | $2,632 | $59,543 | $5,393 | $54,150 |
| 2018 | $2,569 | $57,552 | $5,393 | $52,159 |
| 2017 | $2,509 | $57,552 | $5,393 | $52,159 |
| 2016 | $2,509 | $57,552 | $5,393 | $52,159 |
| 2015 | $2,527 | $57,551 | $5,393 | $52,159 |
| 2014 | $2,524 | $57,552 | $5,393 | $52,159 |
| 2013 | -- | $51,181 | $5,392 | $45,788 |
Source: Public Records
Map
Nearby Homes