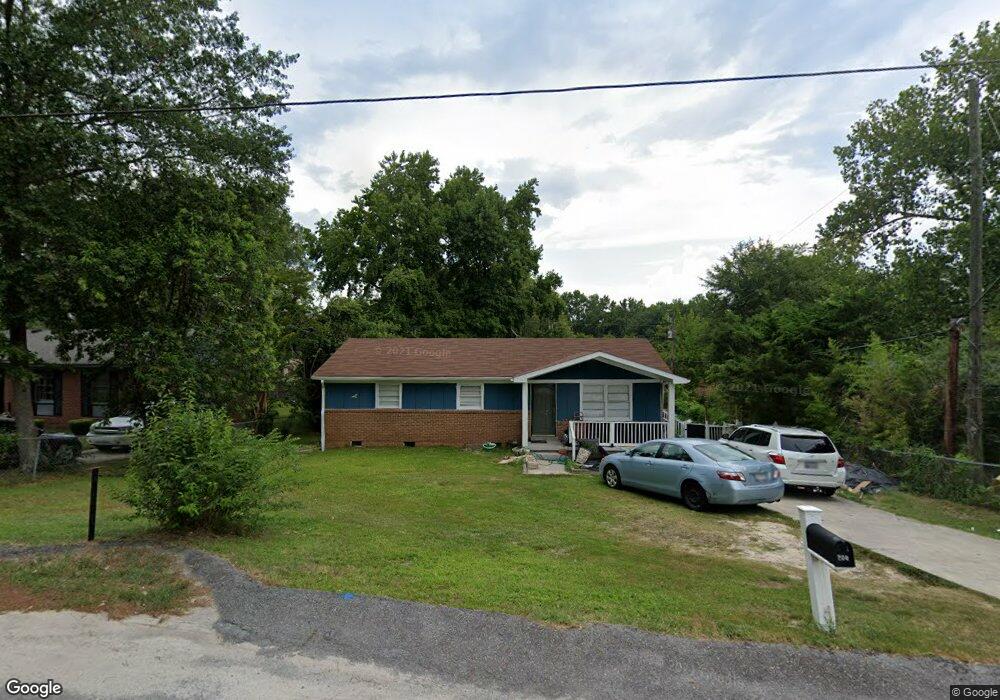
200 Horseshoe Cir Columbia, SC 29223
Dentsville NeighborhoodEstimated Value: $116,000 - $163,000
4
Beds
2
Baths
1,118
Sq Ft
$127/Sq Ft
Est. Value
About This Home
This home is located at 200 Horseshoe Cir, Columbia, SC 29223 and is currently estimated at $142,275, approximately $127 per square foot. 200 Horseshoe Cir is a home located in Richland County with nearby schools including Windsor Elementary School, E. L. Wright Middle School, and Westwood High School.
Ownership History
Date
Name
Owned For
Owner Type
Purchase Details
Closed on
Oct 2, 2001
Sold by
Dinkins Wilbert
Bought by
Green Laura J
Current Estimated Value
Home Financials for this Owner
Home Financials are based on the most recent Mortgage that was taken out on this home.
Original Mortgage
$67,928
Outstanding Balance
$26,589
Interest Rate
6.89%
Mortgage Type
FHA
Estimated Equity
$115,686
Purchase Details
Closed on
Apr 6, 2001
Sold by
S & D Investments
Bought by
Dinkins Wilbert
Home Financials for this Owner
Home Financials are based on the most recent Mortgage that was taken out on this home.
Original Mortgage
$43,000
Interest Rate
7.01%
Purchase Details
Closed on
Jul 20, 2000
Sold by
Freeman Shirley H
Bought by
Freeman Shirley H and Freeman James Wayne
Purchase Details
Closed on
Jul 2, 2000
Sold by
Freeman Shirley H and Kinlaw Shirley Delaine
Bought by
S & D Investment Co
Create a Home Valuation Report for This Property
The Home Valuation Report is an in-depth analysis detailing your home's value as well as a comparison with similar homes in the area
Home Values in the Area
Average Home Value in this Area
Purchase History
| Date | Buyer | Sale Price | Title Company |
|---|---|---|---|
| Green Laura J | $69,000 | -- | |
| Dinkins Wilbert | $61,000 | -- | |
| Freeman Shirley H | -- | -- | |
| S & D Investment Co | $30,000 | -- |
Source: Public Records
Mortgage History
| Date | Status | Borrower | Loan Amount |
|---|---|---|---|
| Open | Green Laura J | $67,928 | |
| Previous Owner | Dinkins Wilbert | $43,000 |
Source: Public Records
Tax History Compared to Growth
Tax History
| Year | Tax Paid | Tax Assessment Tax Assessment Total Assessment is a certain percentage of the fair market value that is determined by local assessors to be the total taxable value of land and additions on the property. | Land | Improvement |
|---|---|---|---|---|
| 2024 | $1,941 | $47,700 | $0 | $0 |
| 2023 | $1,895 | $1,660 | $0 | $0 |
| 2022 | $1,732 | $41,500 | $6,200 | $35,300 |
| 2021 | $1,713 | $2,490 | $0 | $0 |
| 2020 | $1,720 | $2,490 | $0 | $0 |
| 2019 | $1,688 | $2,490 | $0 | $0 |
| 2018 | $1,489 | $2,170 | $0 | $0 |
| 2017 | $1,456 | $2,170 | $0 | $0 |
| 2016 | $1,449 | $2,170 | $0 | $0 |
| 2015 | $1,413 | $2,170 | $0 | $0 |
| 2014 | $1,398 | $36,100 | $0 | $0 |
| 2013 | -- | $2,170 | $0 | $0 |
Source: Public Records
Map
Nearby Homes
- 210 Horseshoe Cir
- 409 Todd Branch Dr
- 401 Todd Branch Dr
- 415 Todd Branch Dr
- 218 Horseshoe Cir
- 105 Kline Ct
- 419 Todd Branch Dr
- 111 Kline Ct
- 198 Horseshoe Cir
- 423 Todd Branch Dr
- 226 Horseshoe Cir
- 321 Todd Branch Dr
- 201 Horseshoe Cir
- 5 Horseshoe Cir
- 427 Todd Branch Dr
- 317 Todd Branch Dr
- 232 Horseshoe Cir
- 112 Kline Ct
- 408 Todd Branch Dr
- 412 Todd Branch Dr