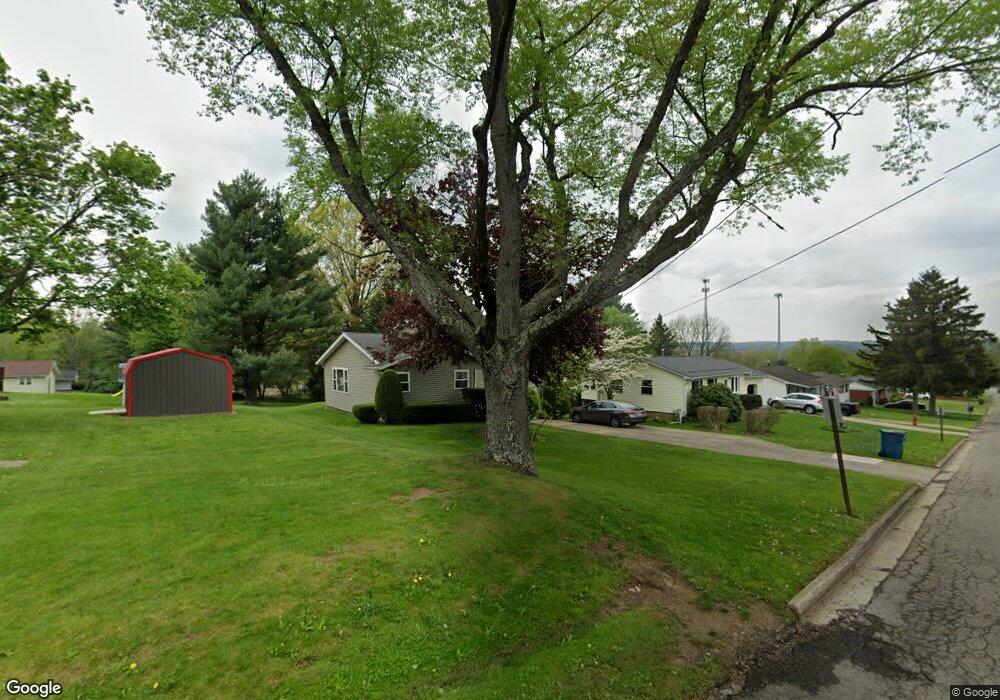
200 James St Mount Vernon, OH 43050
Estimated Value: $213,098 - $233,000
3
Beds
2
Baths
1,144
Sq Ft
$194/Sq Ft
Est. Value
About This Home
This home is located at 200 James St, Mount Vernon, OH 43050 and is currently estimated at $221,525, approximately $193 per square foot. 200 James St is a home located in Knox County with nearby schools including Mount Vernon High School, St. Vincent de Paul School, and Ruscel Montessori Childrens House.
Ownership History
Date
Name
Owned For
Owner Type
Purchase Details
Closed on
Jun 16, 2008
Sold by
Smith George C
Bought by
Epley James S
Current Estimated Value
Home Financials for this Owner
Home Financials are based on the most recent Mortgage that was taken out on this home.
Original Mortgage
$63,650
Interest Rate
5.63%
Mortgage Type
New Conventional
Purchase Details
Closed on
Sep 11, 1992
Sold by
Smith George C and Smith Virginia
Bought by
Smith George C
Purchase Details
Closed on
Nov 5, 1990
Sold by
Carter Ronald H and Carter Sue
Bought by
Smith George C and Smith Virginia
Create a Home Valuation Report for This Property
The Home Valuation Report is an in-depth analysis detailing your home's value as well as a comparison with similar homes in the area
Home Values in the Area
Average Home Value in this Area
Purchase History
| Date | Buyer | Sale Price | Title Company |
|---|---|---|---|
| Epley James S | $50,250 | None Available | |
| Smith George C | -- | -- | |
| Smith George C | $63,500 | -- |
Source: Public Records
Mortgage History
| Date | Status | Borrower | Loan Amount |
|---|---|---|---|
| Closed | Epley James S | $63,650 |
Source: Public Records
Tax History
| Year | Tax Paid | Tax Assessment Tax Assessment Total Assessment is a certain percentage of the fair market value that is determined by local assessors to be the total taxable value of land and additions on the property. | Land | Improvement |
|---|---|---|---|---|
| 2024 | $2,047 | $54,260 | $9,080 | $45,180 |
| 2023 | $2,093 | $54,260 | $9,080 | $45,180 |
| 2022 | $1,655 | $39,030 | $6,530 | $32,500 |
| 2021 | $1,655 | $39,030 | $6,530 | $32,500 |
| 2020 | $1,613 | $39,030 | $6,530 | $32,500 |
| 2019 | $1,447 | $32,630 | $7,050 | $25,580 |
| 2018 | $1,447 | $32,630 | $7,050 | $25,580 |
| 2017 | $1,421 | $32,630 | $7,050 | $25,580 |
| 2016 | $1,318 | $30,210 | $6,530 | $23,680 |
| 2015 | $1,324 | $30,210 | $6,530 | $23,680 |
| 2014 | $1,331 | $30,210 | $6,530 | $23,680 |
| 2013 | $1,437 | $31,060 | $6,140 | $24,920 |
Source: Public Records
Map
Nearby Homes
- 1309 N Mulberry St
- 0 N Sandusky St
- 10 Buena Vista Ave
- 717 N Sandusky St
- 717 N Sandusky St Unit 14
- 305 Cooper St
- 800 N Sandusky St
- 301 Locust St
- 607 N Mulberry St
- 0 W Pleasant St
- 608 N Gay St
- 403 N Mulberry St
- 107 E Lamartine St
- 111 E Lamartine St
- 332 Wooster Rd
- 200 1/2 Walnut St
- 304 N Gay St
- 6 Elliott St
- 12 Third Ave
- 12 3rd Ave
Your Personal Tour Guide
Ask me questions while you tour the home.