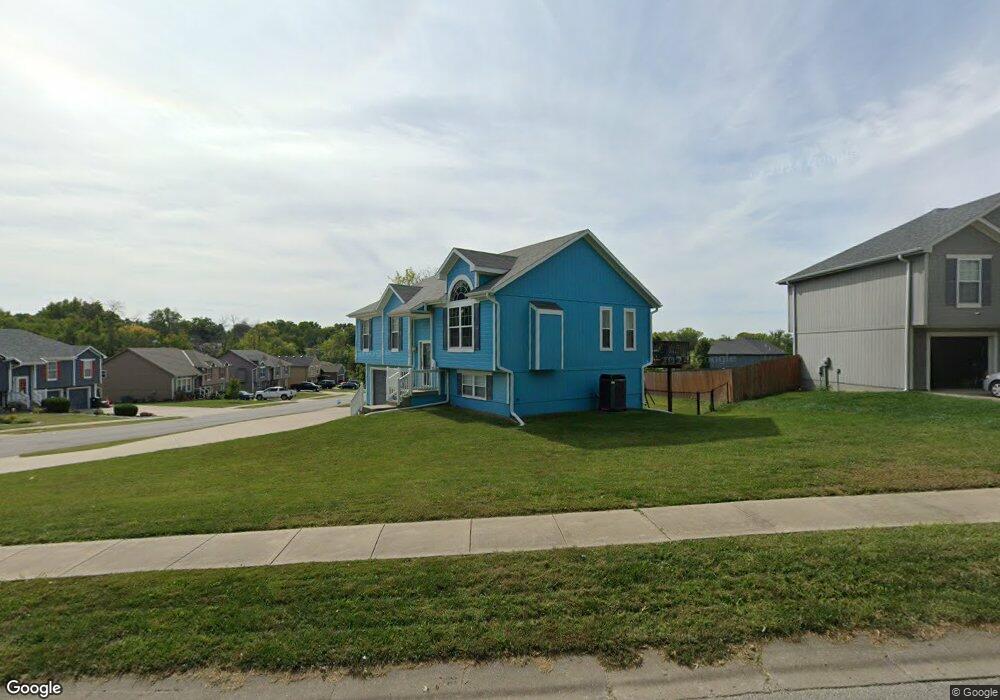
200 Lacy Ln Belton, MO 64012
Estimated Value: $308,000 - $314,000
3
Beds
2
Baths
1,281
Sq Ft
$243/Sq Ft
Est. Value
About This Home
This home is located at 200 Lacy Ln, Belton, MO 64012 and is currently estimated at $310,901, approximately $242 per square foot. 200 Lacy Ln is a home located in Cass County with nearby schools including Cambridge Elementary School, Mill Creek Upper Elementary School, and Belton Middle School.
Ownership History
Date
Name
Owned For
Owner Type
Purchase Details
Closed on
Sep 13, 2005
Sold by
Sales Enterprises Llc
Bought by
Murtha Robert J and Murtha Amy L
Current Estimated Value
Home Financials for this Owner
Home Financials are based on the most recent Mortgage that was taken out on this home.
Original Mortgage
$160,973
Outstanding Balance
$85,850
Interest Rate
5.8%
Mortgage Type
FHA
Estimated Equity
$225,051
Create a Home Valuation Report for This Property
The Home Valuation Report is an in-depth analysis detailing your home's value as well as a comparison with similar homes in the area
Home Values in the Area
Average Home Value in this Area
Purchase History
| Date | Buyer | Sale Price | Title Company |
|---|---|---|---|
| Murtha Robert J | -- | -- |
Source: Public Records
Mortgage History
| Date | Status | Borrower | Loan Amount |
|---|---|---|---|
| Open | Murtha Robert J | $160,973 |
Source: Public Records
Tax History Compared to Growth
Tax History
| Year | Tax Paid | Tax Assessment Tax Assessment Total Assessment is a certain percentage of the fair market value that is determined by local assessors to be the total taxable value of land and additions on the property. | Land | Improvement |
|---|---|---|---|---|
| 2024 | $3,004 | $36,440 | $4,690 | $31,750 |
| 2023 | $2,997 | $36,440 | $4,690 | $31,750 |
| 2022 | $2,675 | $32,240 | $4,690 | $27,550 |
| 2021 | $2,675 | $32,240 | $4,690 | $27,550 |
| 2020 | $2,638 | $31,600 | $4,690 | $26,910 |
| 2019 | $2,583 | $31,600 | $4,690 | $26,910 |
| 2018 | $2,277 | $28,100 | $3,940 | $24,160 |
| 2017 | $2,173 | $28,100 | $3,940 | $24,160 |
| 2016 | $2,173 | $26,660 | $3,940 | $22,720 |
| 2015 | $2,173 | $26,660 | $3,940 | $22,720 |
| 2014 | $2,180 | $26,660 | $3,940 | $22,720 |
| 2013 | -- | $26,660 | $3,940 | $22,720 |
Source: Public Records
Map
Nearby Homes