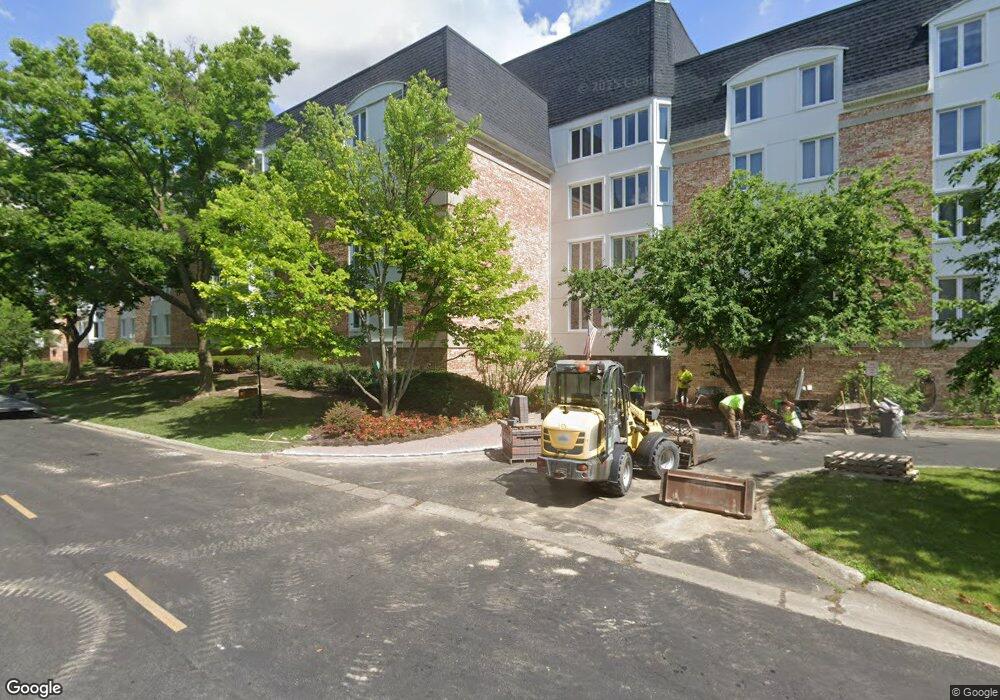
200 Lake Blvd Unit 14 Buffalo Grove, IL 60089
South Buffalo Grove NeighborhoodEstimated Value: $257,000 - $265,000
2
Beds
--
Bath
91,552
Sq Ft
$3/Sq Ft
Est. Value
About This Home
This home is located at 200 Lake Blvd Unit 14, Buffalo Grove, IL 60089 and is currently estimated at $260,165, approximately $2 per square foot. 200 Lake Blvd Unit 14 is a home located in Cook County with nearby schools including Booth Tarkington Elementary School, Jack London Middle School, and Wheeling High School.
Ownership History
Date
Name
Owned For
Owner Type
Purchase Details
Closed on
May 13, 2024
Sold by
Mercado Benjamin and Mercado Carmen
Bought by
Dillon Cynthia and Ibarra Julian Ricardo
Current Estimated Value
Home Financials for this Owner
Home Financials are based on the most recent Mortgage that was taken out on this home.
Original Mortgage
$207,000
Outstanding Balance
$204,254
Interest Rate
7.17%
Mortgage Type
New Conventional
Estimated Equity
$55,911
Purchase Details
Closed on
Aug 22, 2017
Sold by
Bushnick Rubye J
Bought by
Mercado Benjamin and Mercado Carmen
Purchase Details
Closed on
Jul 12, 1995
Sold by
Bushnick Arnold and Bushnick Rubye J
Bought by
Bushnick Arnold and Bushnick Rubye J
Home Financials for this Owner
Home Financials are based on the most recent Mortgage that was taken out on this home.
Original Mortgage
$97,000
Interest Rate
7.5%
Create a Home Valuation Report for This Property
The Home Valuation Report is an in-depth analysis detailing your home's value as well as a comparison with similar homes in the area
Home Values in the Area
Average Home Value in this Area
Purchase History
| Date | Buyer | Sale Price | Title Company |
|---|---|---|---|
| Dillon Cynthia | $230,000 | None Listed On Document | |
| Mercado Benjamin | $147,500 | Premier Title | |
| Bushnick Arnold | -- | Lawyers Title Insurance Corp |
Source: Public Records
Mortgage History
| Date | Status | Borrower | Loan Amount |
|---|---|---|---|
| Open | Dillon Cynthia | $207,000 | |
| Previous Owner | Bushnick Arnold | $97,000 |
Source: Public Records
Tax History Compared to Growth
Tax History
| Year | Tax Paid | Tax Assessment Tax Assessment Total Assessment is a certain percentage of the fair market value that is determined by local assessors to be the total taxable value of land and additions on the property. | Land | Improvement |
|---|---|---|---|---|
| 2024 | $3,440 | $16,718 | $475 | $16,243 |
| 2023 | $3,252 | $16,718 | $475 | $16,243 |
| 2022 | $3,252 | $16,718 | $475 | $16,243 |
| 2021 | $2,706 | $13,654 | $118 | $13,536 |
| 2020 | $2,774 | $13,654 | $118 | $13,536 |
| 2019 | $2,782 | $15,157 | $118 | $15,039 |
| 2018 | $1,490 | $10,509 | $105 | $10,404 |
| 2017 | $3,553 | $10,509 | $105 | $10,404 |
| 2016 | $1,432 | $10,509 | $105 | $10,404 |
| 2015 | $1,627 | $9,360 | $224 | $9,136 |
| 2014 | $1,567 | $9,360 | $224 | $9,136 |
| 2013 | $919 | $9,360 | $224 | $9,136 |
Source: Public Records
Map
Nearby Homes
- 200 Lake Blvd Unit 439
- 314 Anthony Rd
- 175 Lake Blvd Unit 301
- 150 Lake Blvd Unit 125
- 416 Trinity Ct
- 250 Lake Blvd Unit 218
- 100 Lake Blvd Unit 603
- 50 Lake Blvd Unit 632
- 400 E Dundee Rd Unit 408
- 400 E Dundee Rd Unit 207C
- 441 Commanche Trail Unit 3100
- 52 Schoenbeck Rd
- 1637 Tahoe Circle Dr Unit 209
- 413 Buffalo Trail Unit 10601
- 3400 N Buffalo Grove Rd
- 1485 Chippewa Trail
- 3401 N Ellen Dr
- 3026 Jackson Dr
- 528 Surf Ct
- 51 Old Oak Dr Unit 302
- 200 Lake Blvd Unit 408
- 200 Lake Blvd Unit 442
- 200 Lake Blvd Unit 459
- 200 Lake Blvd Unit 54
- 200 Lake Blvd Unit 60
- 200 Lake Blvd Unit 53
- 200 Lake Blvd Unit 35
- 200 Lake Blvd Unit 28
- 200 Lake Blvd Unit 6
- 200 Lake Blvd Unit 33
- 200 Lake Blvd Unit 29
- 200 Lake Blvd Unit 22
- 200 Lake Blvd Unit 17
- 200 Lake Blvd Unit 48
- 200 Lake Blvd Unit 9
- 200 Lake Blvd Unit 7
- 200 Lake Blvd Unit 10
- 200 Lake Blvd Unit 36
- 200 Lake Blvd Unit 46
- 200 Lake Blvd Unit 18