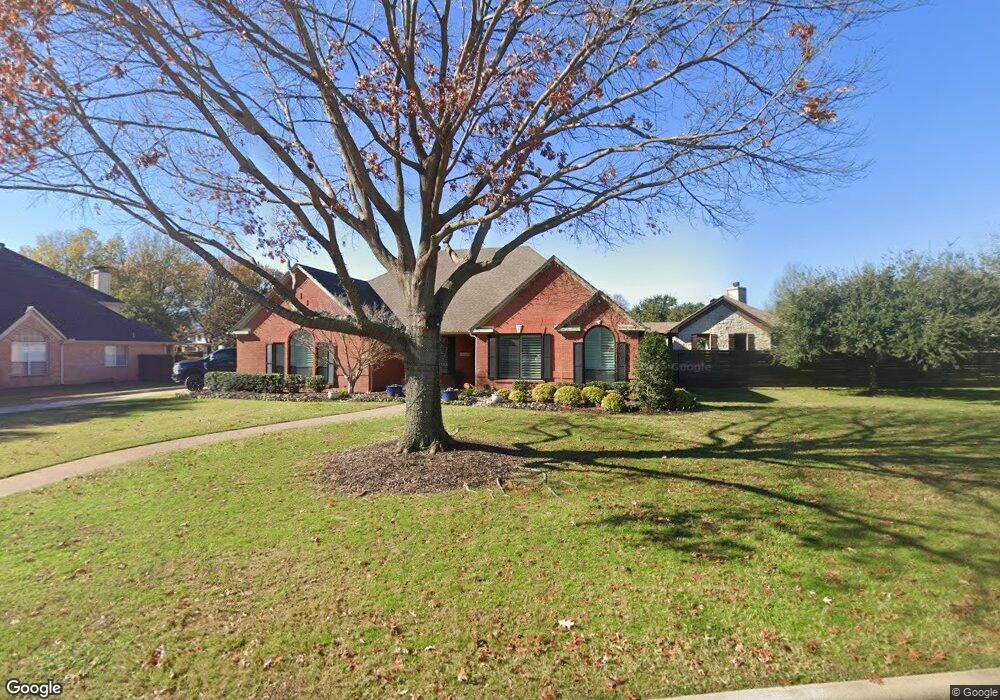
200 Lake Crest Dr Southlake, TX 76092
Estimated Value: $1,045,000 - $1,275,000
4
Beds
3
Baths
2,861
Sq Ft
$404/Sq Ft
Est. Value
About This Home
This home is located at 200 Lake Crest Dr, Southlake, TX 76092 and is currently estimated at $1,154,744, approximately $403 per square foot. 200 Lake Crest Dr is a home located in Tarrant County with nearby schools including Robert High Rockenbaugh Elementary School, Eubanks Intermediate School, and George Dawson Middle School.
Ownership History
Date
Name
Owned For
Owner Type
Purchase Details
Closed on
Oct 28, 2020
Sold by
Manero Matthew J and Manero Rokki
Bought by
Matthew And Rokki Manero Living Trust and Manero
Current Estimated Value
Purchase Details
Closed on
May 15, 2007
Sold by
Yonis Richard J and Yonis Robin I
Bought by
Manero Matthew J
Home Financials for this Owner
Home Financials are based on the most recent Mortgage that was taken out on this home.
Original Mortgage
$288,000
Interest Rate
6.16%
Mortgage Type
Purchase Money Mortgage
Purchase Details
Closed on
Mar 29, 1996
Sold by
Pulte Home Corp Of Texas
Bought by
Yonis Richard J and Yonis Debra A
Home Financials for this Owner
Home Financials are based on the most recent Mortgage that was taken out on this home.
Original Mortgage
$180,000
Interest Rate
7.35%
Create a Home Valuation Report for This Property
The Home Valuation Report is an in-depth analysis detailing your home's value as well as a comparison with similar homes in the area
Home Values in the Area
Average Home Value in this Area
Purchase History
| Date | Buyer | Sale Price | Title Company |
|---|---|---|---|
| Matthew And Rokki Manero Living Trust | -- | None Listed On Document | |
| Manero Matthew J | -- | None Available | |
| Yonis Richard J | -- | First American Title Co |
Source: Public Records
Mortgage History
| Date | Status | Borrower | Loan Amount |
|---|---|---|---|
| Previous Owner | Manero Matthew J | $288,000 | |
| Previous Owner | Yonis Richard J | $180,000 |
Source: Public Records
Tax History Compared to Growth
Tax History
| Year | Tax Paid | Tax Assessment Tax Assessment Total Assessment is a certain percentage of the fair market value that is determined by local assessors to be the total taxable value of land and additions on the property. | Land | Improvement |
|---|---|---|---|---|
| 2025 | $13,070 | $973,000 | $426,000 | $547,000 |
| 2024 | $13,070 | $1,173,955 | $426,000 | $747,955 |
| 2023 | $14,415 | $1,177,445 | $426,000 | $751,445 |
| 2022 | $15,512 | $932,843 | $292,500 | $640,343 |
| 2021 | $14,903 | $653,632 | $292,500 | $361,132 |
| 2020 | $16,341 | $710,902 | $301,500 | $409,402 |
| 2019 | $15,890 | $656,212 | $150,000 | $506,212 |
| 2018 | $14,168 | $622,292 | $125,000 | $497,292 |
| 2017 | $14,022 | $613,211 | $100,000 | $513,211 |
| 2016 | $12,747 | $561,674 | $100,000 | $461,674 |
| 2015 | $9,904 | $467,537 | $60,000 | $407,537 |
| 2014 | $9,904 | $411,600 | $60,000 | $351,600 |
Source: Public Records
Map
Nearby Homes
- 205 Edinburgh Ct
- 102 Springbrook Ct
- 305 Canyon Lake Dr
- 806 Ridgedale Ct
- 800 Woodcrest Ct
- 806 Shadow Glen Dr
- 300 Shady Oaks Dr
- 351 S White Chapel Blvd
- 221 Pine Dr
- 305 Sheffield Dr
- 802 Princeton Ct
- 608 Stratford Dr
- 903 San Saba Dr
- 203 Manor Place
- 403 Presidio Ct
- 204 Southridge Lakes Pkwy
- 810 Brazos Dr
- 912 Berkshire Rd
- 712 Ashleigh Ln
- 900 Kingsbury Way
- 202 Lake Crest Dr
- 203 Canyon Lake Dr
- 101 Clear Lake Ct
- 204 Lake Crest Dr
- 200 Canyon Lake Dr
- 201 Lake Crest Dr
- 203 Lake Crest Dr
- 207 Canyon Lake Dr
- 202 Canyon Lake Dr
- 100 Clear Lake Ct
- 103 Clear Lake Ct
- 204 Canyon Lake Dr
- 205 Lake Crest Dr
- 206 Lake Crest Dr
- 209 Canyon Lake Dr
- 207 Lake Crest Dr
- 102 Clear Lake Ct
- 206 Canyon Lake Dr
- 211 Canyon Lake Dr
- 104 Clear Lake Ct