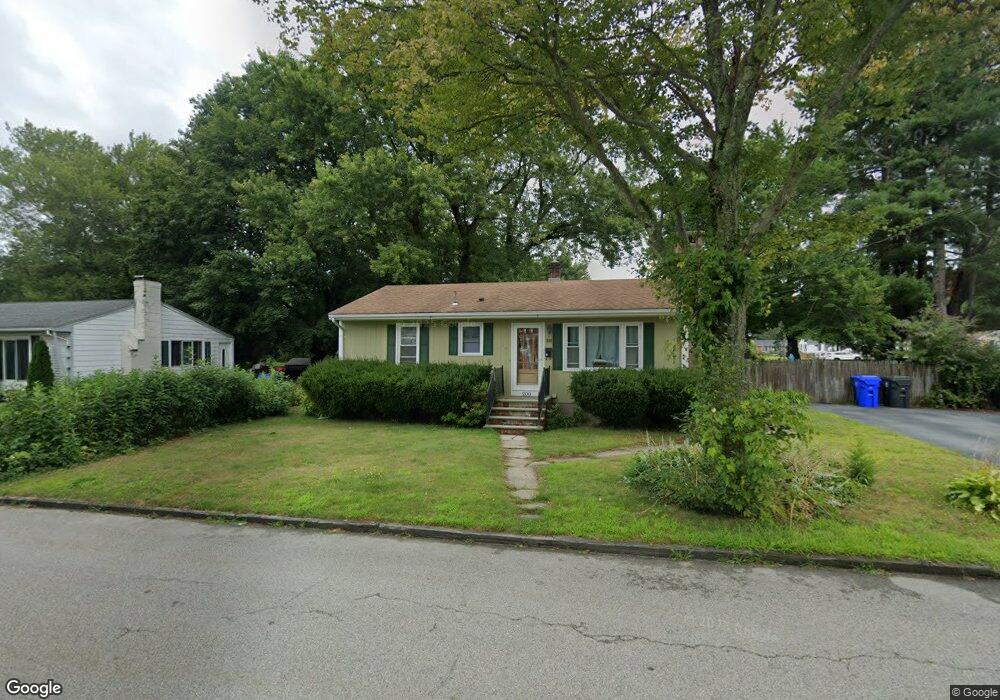
200 Lockwood St West Warwick, RI 02893
Centreville NeighborhoodEstimated Value: $345,000 - $387,000
3
Beds
1
Bath
929
Sq Ft
$390/Sq Ft
Est. Value
About This Home
This home is located at 200 Lockwood St, West Warwick, RI 02893 and is currently estimated at $362,727, approximately $390 per square foot. 200 Lockwood St is a home located in Kent County with nearby schools including West Warwick High School.
Ownership History
Date
Name
Owned For
Owner Type
Purchase Details
Closed on
Mar 19, 2024
Sold by
Kittredge Daniel A
Bought by
Kittredge Daniel A and Riemer Erin L
Current Estimated Value
Purchase Details
Closed on
Oct 31, 2022
Sold by
Ulterback Lauri A and Messier Lauri A
Bought by
Kittredge Daniel A
Home Financials for this Owner
Home Financials are based on the most recent Mortgage that was taken out on this home.
Original Mortgage
$265,052
Interest Rate
6.02%
Mortgage Type
Purchase Money Mortgage
Purchase Details
Closed on
Jan 13, 2016
Sold by
Messier Lauri A and Messier John P
Bought by
Messier Lauri A
Purchase Details
Closed on
Nov 9, 1989
Sold by
Mcabes Cynthia
Bought by
Bjorkland Bruce
Home Financials for this Owner
Home Financials are based on the most recent Mortgage that was taken out on this home.
Original Mortgage
$105,050
Interest Rate
10.03%
Mortgage Type
Purchase Money Mortgage
Create a Home Valuation Report for This Property
The Home Valuation Report is an in-depth analysis detailing your home's value as well as a comparison with similar homes in the area
Home Values in the Area
Average Home Value in this Area
Purchase History
| Date | Buyer | Sale Price | Title Company |
|---|---|---|---|
| Kittredge Daniel A | -- | None Available | |
| Kittredge Daniel A | -- | None Available | |
| Kittredge Daniel A | $273,250 | None Available | |
| Kittredge Daniel A | $273,250 | None Available | |
| Messier Lauri A | -- | -- | |
| Bjorkland Bruce | $105,000 | -- | |
| Bjorkland Bruce | $105,000 | -- |
Source: Public Records
Mortgage History
| Date | Status | Borrower | Loan Amount |
|---|---|---|---|
| Previous Owner | Kittredge Daniel A | $265,052 | |
| Previous Owner | Bjorkland Bruce | $99,350 | |
| Previous Owner | Bjorkland Bruce | $76,060 | |
| Previous Owner | Bjorkland Bruce | $105,050 |
Source: Public Records
Tax History Compared to Growth
Tax History
| Year | Tax Paid | Tax Assessment Tax Assessment Total Assessment is a certain percentage of the fair market value that is determined by local assessors to be the total taxable value of land and additions on the property. | Land | Improvement |
|---|---|---|---|---|
| 2025 | $4,526 | $316,700 | $112,000 | $204,700 |
| 2024 | $4,259 | $227,900 | $75,000 | $152,900 |
| 2023 | $4,175 | $227,900 | $75,000 | $152,900 |
| 2022 | $4,111 | $227,900 | $75,000 | $152,900 |
| 2021 | $3,974 | $172,800 | $62,500 | $110,300 |
| 2020 | $3,974 | $172,800 | $62,500 | $110,300 |
| 2019 | $5,066 | $172,800 | $62,500 | $110,300 |
| 2018 | $3,676 | $139,200 | $65,000 | $74,200 |
| 2017 | $3,662 | $139,200 | $65,000 | $74,200 |
| 2016 | $3,597 | $139,200 | $65,000 | $74,200 |
| 2015 | $3,453 | $133,000 | $65,000 | $68,000 |
| 2014 | $844 | $133,000 | $65,000 | $68,000 |
Source: Public Records
Map
Nearby Homes
- 18 Jacques St
- 33 Judy Terrace
- 64 Lockwood St
- 16 Ontario St
- 177 Cowesett Ave
- 170 Cowesett Ave
- 34 Buckley Ave
- 125 Revere Ave
- 101 Quaker Ln
- 76 Sycamore Dr
- 52 Glen Dr
- 565 Quaker Ln Unit 58
- 565 Quaker Ln Unit 124
- 3 June Ct
- 1199 Centerville Rd
- 125 Setian Ln
- 6 Teresa Ann Crossing
- 5 W Glen Ln
- 8 Teresa Ann Crossing
- 2 Teresa Ann Crossing