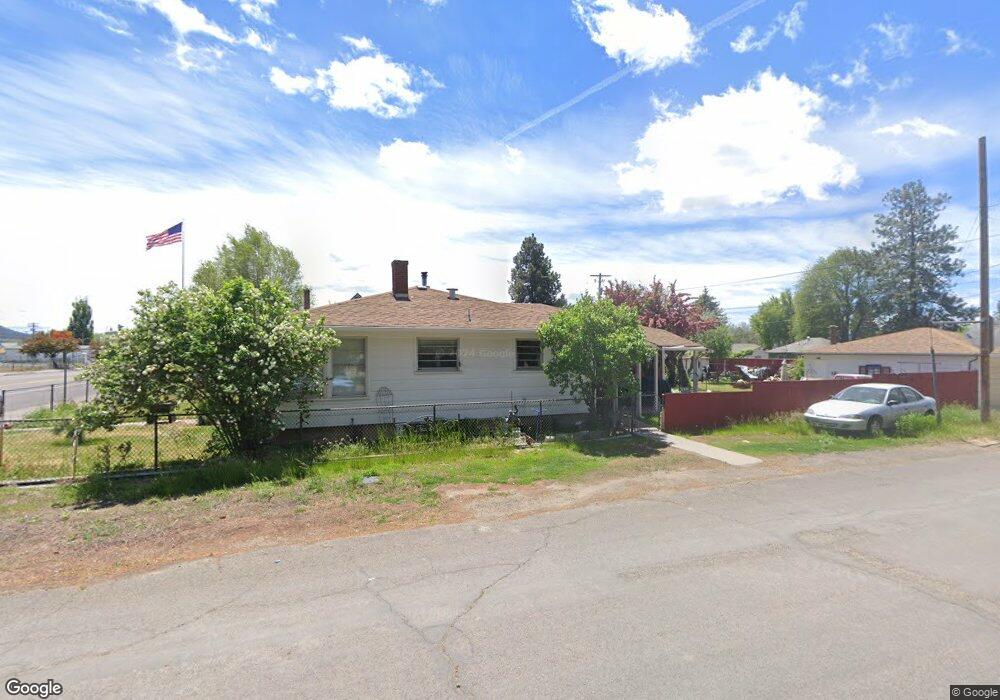
200 Main St Dorris, CA 96023
Estimated Value: $210,000 - $228,000
2
Beds
1
Bath
1,238
Sq Ft
$176/Sq Ft
Est. Value
About This Home
This home is located at 200 Main St, Dorris, CA 96023 and is currently estimated at $217,370, approximately $175 per square foot. 200 Main St is a home located in Siskiyou County with nearby schools including Picard Community Day Elementary School, Butte Valley Elementary & Middle School, and Cascade High School.
Ownership History
Date
Name
Owned For
Owner Type
Purchase Details
Closed on
Apr 2, 2026
Sold by
Penelope Jones
Bought by
Overcash Jody
Current Estimated Value
Home Financials for this Owner
Home Financials are based on the most recent Mortgage that was taken out on this home.
Original Mortgage
$211,105
Outstanding Balance
$211,105
Interest Rate
5.98%
Mortgage Type
FHA
Estimated Equity
$6,265
Purchase Details
Closed on
May 2, 2024
Sold by
Salyer Clyde T
Bought by
Jones Jody Penelope
Purchase Details
Closed on
Aug 12, 2011
Sold by
Fannie Mae
Bought by
Salyer Clyde T
Purchase Details
Closed on
Nov 3, 2010
Sold by
Salyer Clyde N and Salyer Loretta C
Bought by
Federal National Mortgage Association
Create a Home Valuation Report for This Property
The Home Valuation Report is an in-depth analysis detailing your home's value as well as a comparison with similar homes in the area
Purchase History
We collect this data history from publicly available records. To have your information removed, we recommend requesting removal directly through your county’s website.
| Date | Buyer | Sale Price | Title Company |
|---|---|---|---|
| Overcash Jody | $215,000 | Orange Coast Title | |
| Jones Jody Penelope | $175,000 | Orange Coast Title | |
| Salyer Clyde T | $20,000 | Cornerstone Title Company | |
| Federal National Mortgage Association | $83,809 | Accommodation |
Source: Public Records
Mortgage History
We collect this data history from publicly available records. To have your information removed, we recommend requesting removal directly through your county’s website.
| Date | Status | Borrower | Loan Amount |
|---|---|---|---|
| Open | Overcash Jody | $211,105 |
Source: Public Records
Tax History
| Year | Tax Paid | Tax Assessment Tax Assessment Total Assessment is a certain percentage of the fair market value that is determined by local assessors to be the total taxable value of land and additions on the property. | Land | Improvement |
|---|---|---|---|---|
| 2025 | $1,298 | $178,500 | $20,400 | $158,100 |
| 2023 | $1,298 | $117,646 | $14,481 | $103,165 |
| 2022 | $1,251 | $115,341 | $14,198 | $101,143 |
| 2021 | $1,229 | $113,080 | $13,920 | $99,160 |
| 2020 | $1,218 | $111,922 | $13,778 | $98,144 |
| 2019 | $1,197 | $109,728 | $13,508 | $96,220 |
| 2018 | $63 | $107,578 | $13,244 | $94,334 |
| 2017 | $63 | $105,470 | $12,985 | $92,485 |
| 2016 | $63 | $103,403 | $12,731 | $90,672 |
| 2015 | -- | $101,851 | $12,540 | $89,311 |
| 2014 | -- | $99,857 | $12,295 | $87,562 |
Source: Public Records
Map
Nearby Homes
- 7001 E Butte Valley Rd
- 00 Shady Dell Rd
- 0 Shady Dell Rd
- 78 Acres Hwy 97
- 2935 Sheep Mountain Rd
- 3138 Sheep Mountain Rd
- 219 S California St
- 224 State St
- 217 S California St
- 200 S California St
- 118 N Oregon St
- 118 & 126 N Oregon St
- 126 N Pine St
- 306 N Main St
- 310 N California St
- 324 N Sage St
- 13330 Homeland Rd
- Unit 2 Lot 168 Pleasant Valley Highlands Unit 2
- 740 N Butte St
- Unit 2 Lot 637 Wildgoose Rd Unit 2
- Unit 2 Lot Dawn Dr Unit 2
- Unit 2 Lot Lake Ridge Unit 2
- Unit 2 Lot Hilltop Rd
- lot 76 & 9 Ponderosa Unit 1
- Lake Ridge Pleasant Valley Highlands
- Lot 6 & 7 Juniper St
- Lot 41 Homeland
- 000 Highway 97
- 0 Fronts Schoolhouse Rd Unit 96927
- 0 40 Ac On Shovel Ck Rd Unit 96935
- 0 20 Ac On Shovel Ck Rd Unit 96934
- 00 State Line Rd
- 10 Acres - Sam's Neck Rd
- 26 acres On Indian Tom Lake
- 223,225,22 Portland
- . Fronts Indian Tom Lake
- 0 20 Ac On Shovel Ck Rd Unit 102451
- 0 Fronts Schoolhouse Rd Unit 102449
- 0 40 Ac On Shovel Ck Rd Unit 102445
- Lt 60 Matthews Rd
Your Personal Tour Guide
Ask me questions while you tour the home.