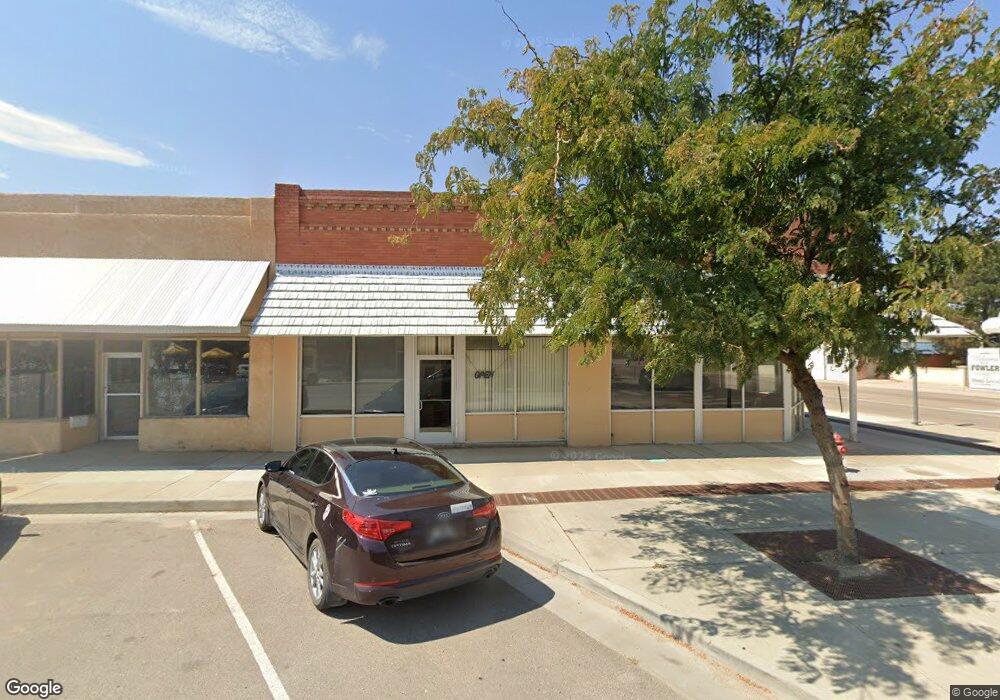
200 Main St Fowler, CO 81039
Estimated Value: $104,625
Studio
--
Bath
4,800
Sq Ft
$22/Sq Ft
Est. Value
About This Home
This home is located at 200 Main St, Fowler, CO 81039 and is currently estimated at $104,625, approximately $21 per square foot. 200 Main St is a home located in Otero County with nearby schools including Fowler Elementary School, Fowler Junior High School, and Fowler High School.
Ownership History
Date
Name
Owned For
Owner Type
Purchase Details
Closed on
May 2, 2022
Sold by
City Of Rocky Ford
Bought by
Odd Fellows Renaissance Llc
Current Estimated Value
Purchase Details
Closed on
May 14, 2021
Sold by
Vansickle Kari M and Vansickle Van Sickle
Bought by
Trl County Housing Inc
Home Financials for this Owner
Home Financials are based on the most recent Mortgage that was taken out on this home.
Original Mortgage
$74,400
Interest Rate
3.1%
Mortgage Type
Purchase Money Mortgage
Create a Home Valuation Report for This Property
The Home Valuation Report is an in-depth analysis detailing your home's value as well as a comparison with similar homes in the area
Purchase History
| Date | Buyer | Sale Price | Title Company |
|---|---|---|---|
| Odd Fellows Renaissance Llc | $130,000 | None Listed On Document | |
| Trl County Housing Inc | $93,000 | Unified Title Company |
Source: Public Records
Mortgage History
| Date | Status | Borrower | Loan Amount |
|---|---|---|---|
| Previous Owner | Trl County Housing Inc | $74,400 |
Source: Public Records
Tax History
| Year | Tax Paid | Tax Assessment Tax Assessment Total Assessment is a certain percentage of the fair market value that is determined by local assessors to be the total taxable value of land and additions on the property. | Land | Improvement |
|---|---|---|---|---|
| 2025 | $2,713 | $34,301 | $0 | $0 |
| 2024 | $2,128 | $25,509 | $2,812 | $22,697 |
| 2023 | $2,128 | $25,509 | $2,812 | $22,697 |
| 2022 | $2,450 | $29,250 | $2,923 | $26,327 |
| 2021 | $1,388 | $16,736 | $2,923 | $13,813 |
| 2020 | $1,128 | $16,155 | $2,923 | $13,232 |
| 2019 | $1,130 | $16,155 | $2,923 | $13,232 |
| 2018 | $1,305 | $17,045 | $2,923 | $14,122 |
| 2017 | $1,307 | $17,045 | $2,923 | $14,122 |
| 2016 | $2,018 | $26,449 | $2,923 | $23,526 |
| 2015 | $2,220 | $26,449 | $2,923 | $23,526 |
| 2014 | $2,220 | $27,169 | $2,923 | $24,246 |
Source: Public Records
Map
Nearby Homes
Your Personal Tour Guide
Ask me questions while you tour the home.