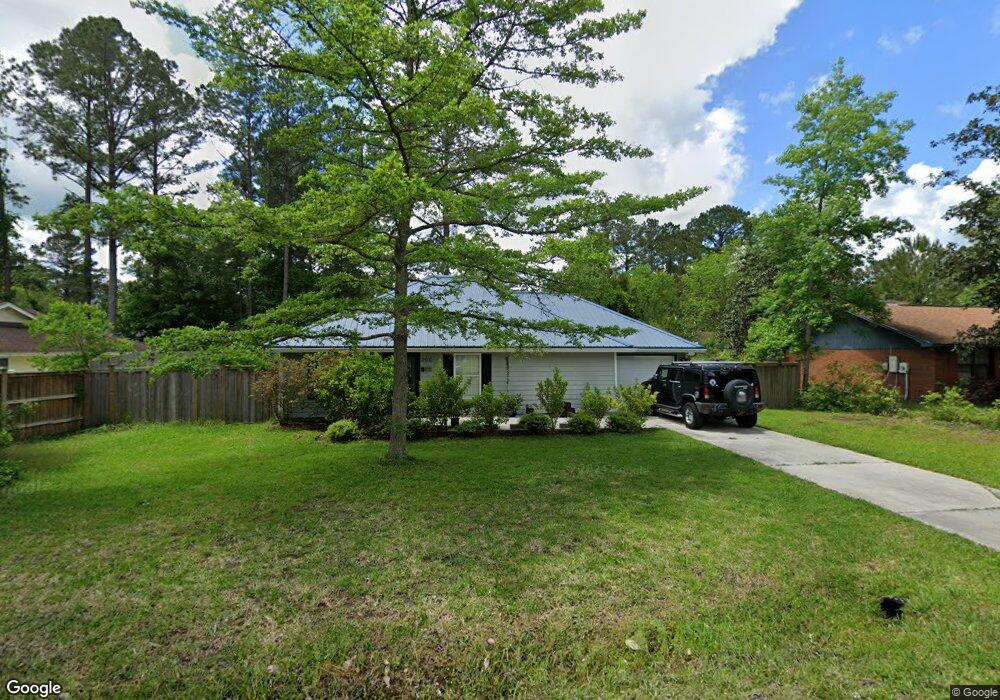
200 Merriwood Cir Kingsland, GA 31548
Estimated Value: $225,000 - $244,000
3
Beds
2
Baths
1,200
Sq Ft
$196/Sq Ft
Est. Value
About This Home
This home is located at 200 Merriwood Cir, Kingsland, GA 31548 and is currently estimated at $235,065, approximately $195 per square foot. 200 Merriwood Cir is a home located in Camden County with nearby schools including Kingsland Elementary School, Camden Middle School, and Camden County High School.
Ownership History
Date
Name
Owned For
Owner Type
Purchase Details
Closed on
Sep 14, 2020
Sold by
Villarreal Rogerio G
Bought by
Bourke Edward
Current Estimated Value
Home Financials for this Owner
Home Financials are based on the most recent Mortgage that was taken out on this home.
Original Mortgage
$140,000
Outstanding Balance
$124,241
Interest Rate
2.9%
Mortgage Type
VA
Estimated Equity
$110,824
Purchase Details
Closed on
Jan 28, 2009
Sold by
D T Home Investments
Bought by
Villarreal Rogerio G
Home Financials for this Owner
Home Financials are based on the most recent Mortgage that was taken out on this home.
Original Mortgage
$127,687
Interest Rate
5.08%
Mortgage Type
VA
Purchase Details
Closed on
Oct 20, 2008
Sold by
Us Bank National Associati
Bought by
D T Investments Llc
Purchase Details
Closed on
Jul 1, 2008
Sold by
Scott Martin Burtr
Bought by
Us Bank National Association
Create a Home Valuation Report for This Property
The Home Valuation Report is an in-depth analysis detailing your home's value as well as a comparison with similar homes in the area
Home Values in the Area
Average Home Value in this Area
Purchase History
| Date | Buyer | Sale Price | Title Company |
|---|---|---|---|
| Bourke Edward | $140,000 | -- | |
| Villarreal Rogerio G | $125,000 | -- | |
| D T Investments Llc | $79,900 | -- | |
| Us Bank National Association | -- | -- |
Source: Public Records
Mortgage History
| Date | Status | Borrower | Loan Amount |
|---|---|---|---|
| Open | Bourke Edward | $140,000 | |
| Previous Owner | Villarreal Rogerio G | $127,687 |
Source: Public Records
Tax History Compared to Growth
Tax History
| Year | Tax Paid | Tax Assessment Tax Assessment Total Assessment is a certain percentage of the fair market value that is determined by local assessors to be the total taxable value of land and additions on the property. | Land | Improvement |
|---|---|---|---|---|
| 2024 | -- | $87,923 | $10,000 | $77,923 |
| 2023 | $2,145 | $70,293 | $10,000 | $60,293 |
| 2022 | $2,145 | $59,990 | $10,000 | $49,990 |
| 2021 | $2,050 | $54,032 | $10,000 | $44,032 |
| 2020 | $1,641 | $41,231 | $10,000 | $31,231 |
| 2019 | $1,641 | $41,231 | $10,000 | $31,231 |
| 2018 | $336 | $41,231 | $10,000 | $31,231 |
| 2017 | $1,470 | $34,142 | $6,000 | $28,142 |
| 2016 | $970 | $32,411 | $6,000 | $26,411 |
| 2015 | $1,199 | $32,411 | $6,000 | $26,411 |
| 2014 | $1,254 | $34,011 | $7,600 | $26,411 |
Source: Public Records
Map
Nearby Homes
- 213 Merriwood Cir
- 208 Foxwood Dr
- 213 Grassmere St
- 232 Woodbridge Rd
- 145 W Woodhaven Dr
- 135 W Woodhaven Dr
- 164 Huntington Dr
- 114 Pineneedle Ct
- 231 Hide Away Lake Dr
- 240 Hide Away Lake Dr
- 508 Hide-A-way Lake Loop
- 524 Hide Away Lake Loop
- 524 Hide-A-way Lake Loop
- 522 Hide-A-way Lake Loop
- 572 Henrietta St
- 0 V L W S Henrietta-3 Acres St Unit 1652107
- 233 S Sheffield St
- 0 W S Henrietta St
- 0 Ashton Ln Unit 1650886
- 216 Landing Blvd
- 128 Merriwood Cir
- 202 Merriwood Cir
- 201 Woodbridge Rd
- 129 Woodbridge Rd
- 201 Merriwood Cir
- 203 Merriwood Cir
- 203 Woodbridge Rd
- 126 Old Folkston Rd
- 126 Old Folkston Rd
- 204 Merriwood Cir
- 205 Merriwood Cir
- 205 Woodbridge Rd
- 129 Old Folkston Rd
- 111 Redwood Ct
- 200 Woodbridge Rd
- 206 Merriwood Cir
- 132 Woodbridge Rd
- 124 Old Folkston Rd
- 202 Woodbridge Rd
- 207 Merriwood Cir