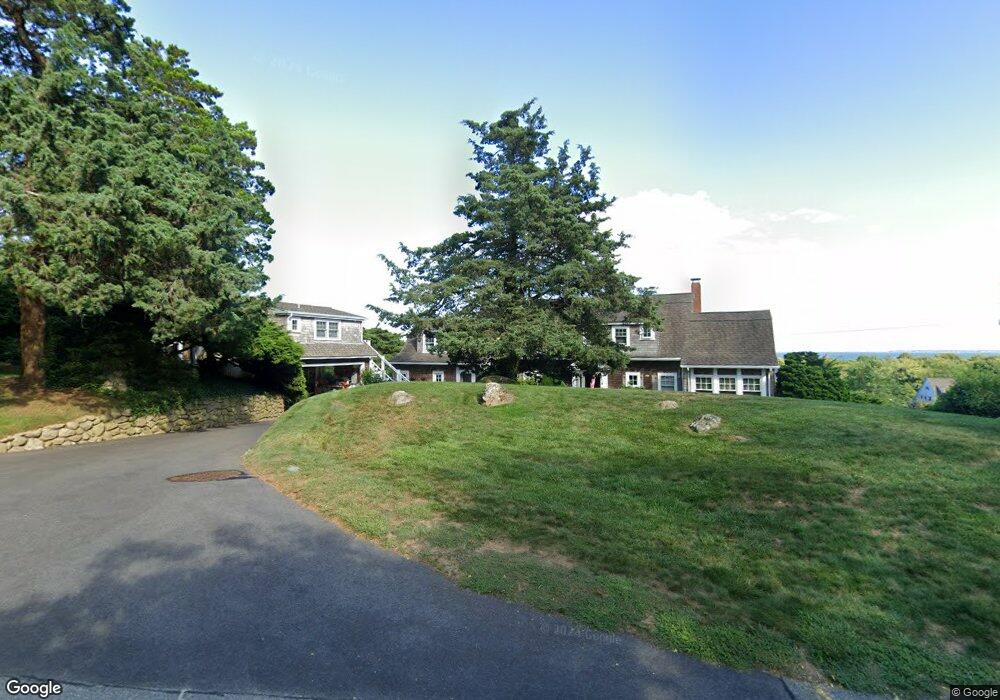
200 Moorland Rd Falmouth, MA 02540
Falmouth Village NeighborhoodEstimated Value: $2,213,930 - $3,012,000
4
Beds
5
Baths
3,263
Sq Ft
$790/Sq Ft
Est. Value
About This Home
This home is located at 200 Moorland Rd, Falmouth, MA 02540 and is currently estimated at $2,576,233, approximately $789 per square foot. 200 Moorland Rd is a home located in Barnstable County with nearby schools including Mullen-Hall School, Lawrence School, and Morse Pond School.
Ownership History
Date
Name
Owned For
Owner Type
Purchase Details
Closed on
Dec 15, 2010
Sold by
Mclean Walter L and Mclean Frances Mary
Bought by
Munier Robert S C and Munier Jan C
Current Estimated Value
Home Financials for this Owner
Home Financials are based on the most recent Mortgage that was taken out on this home.
Original Mortgage
$300,000
Outstanding Balance
$196,756
Interest Rate
4.23%
Mortgage Type
Purchase Money Mortgage
Estimated Equity
$2,379,477
Create a Home Valuation Report for This Property
The Home Valuation Report is an in-depth analysis detailing your home's value as well as a comparison with similar homes in the area
Home Values in the Area
Average Home Value in this Area
Purchase History
| Date | Buyer | Sale Price | Title Company |
|---|---|---|---|
| Munier Robert S C | $1,086,000 | -- | |
| Munier Robert S C | $1,086,000 | -- |
Source: Public Records
Mortgage History
| Date | Status | Borrower | Loan Amount |
|---|---|---|---|
| Open | Munier Robert S C | $300,000 | |
| Closed | Munier Robert S C | $300,000 | |
| Previous Owner | Munier Robert S C | $186,000 |
Source: Public Records
Tax History Compared to Growth
Tax History
| Year | Tax Paid | Tax Assessment Tax Assessment Total Assessment is a certain percentage of the fair market value that is determined by local assessors to be the total taxable value of land and additions on the property. | Land | Improvement |
|---|---|---|---|---|
| 2025 | $12,130 | $2,066,400 | $891,800 | $1,174,600 |
| 2024 | $11,585 | $1,844,800 | $773,900 | $1,070,900 |
| 2023 | $11,622 | $1,679,500 | $773,900 | $905,600 |
| 2022 | $11,139 | $1,383,700 | $751,300 | $632,400 |
| 2021 | $10,305 | $1,212,300 | $688,700 | $523,600 |
| 2020 | $9,876 | $1,149,700 | $626,100 | $523,600 |
| 2019 | $9,800 | $1,144,900 | $626,100 | $518,800 |
| 2018 | $9,607 | $1,117,100 | $626,100 | $491,000 |
| 2017 | $9,393 | $1,101,200 | $626,100 | $475,100 |
| 2016 | $9,217 | $1,101,200 | $626,100 | $475,100 |
| 2015 | $9,019 | $1,101,200 | $626,100 | $475,100 |
| 2014 | $8,682 | $1,065,300 | $626,200 | $439,100 |
Source: Public Records
Map
Nearby Homes
- 38 Landfall Unit 38
- 38 Landfall
- 87 Oyster Pond Rd
- 15 Hedge Ln
- 251 Woods Hole Rd
- 71 Main St
- 65 Walker St
- 98 Main St
- 98 Main St Unit 1
- 44 Carey Ln
- 30 Katherine Lee Bates Rd
- 33 Oakwood Ave
- 45 Haynes Ave
- 76 F r Lillie Rd
- 27 Upland Ave
- 480 Main St Unit 1
- 29 Wilson Rd
- 253 Scranton Ave
- 110 Dillingham Ave Unit 322
- 110 Dillingham Ave Unit 224