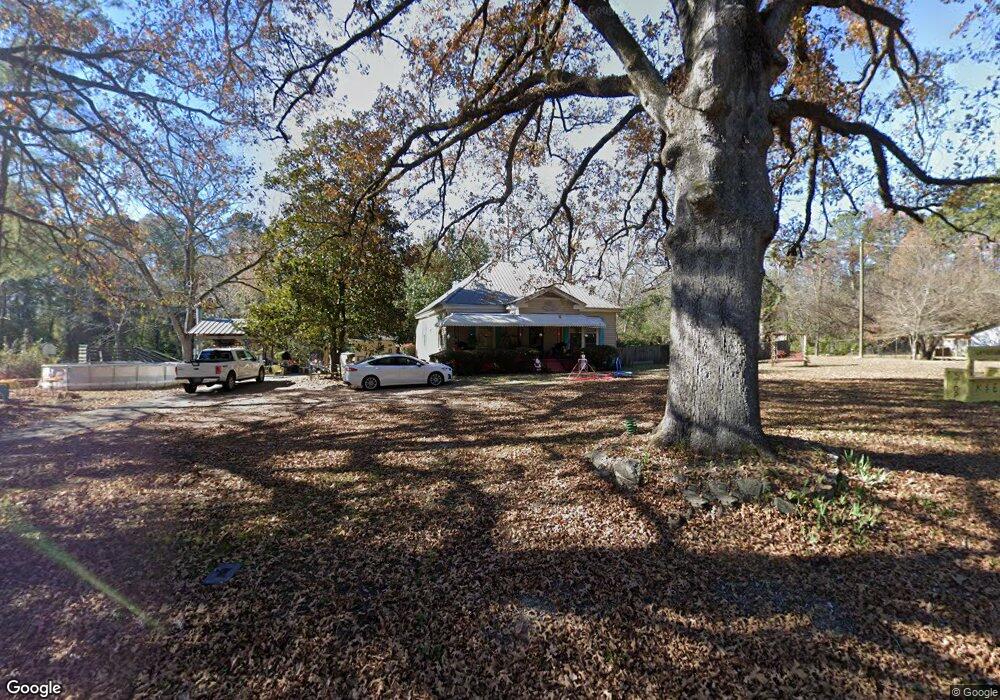
200 Mulberry Dr Fortson, GA 31808
Estimated Value: $147,000 - $249,000
2
Beds
2
Baths
1,512
Sq Ft
$123/Sq Ft
Est. Value
About This Home
This home is located at 200 Mulberry Dr, Fortson, GA 31808 and is currently estimated at $185,711, approximately $122 per square foot. 200 Mulberry Dr is a home located in Harris County with nearby schools including Mulberry Creek Elementary School, Creekside School, and Harris County Carver Middle School.
Ownership History
Date
Name
Owned For
Owner Type
Purchase Details
Closed on
Aug 26, 2021
Sold by
Burleson Chase S
Bought by
Burditt James E and Burditt Telicia A
Current Estimated Value
Home Financials for this Owner
Home Financials are based on the most recent Mortgage that was taken out on this home.
Original Mortgage
$117,826
Outstanding Balance
$106,979
Interest Rate
2.8%
Mortgage Type
FHA
Estimated Equity
$78,732
Purchase Details
Closed on
Jan 3, 2007
Sold by
Burleson Dennis F
Bought by
Burleson Chase S
Home Financials for this Owner
Home Financials are based on the most recent Mortgage that was taken out on this home.
Original Mortgage
$90,000
Interest Rate
6.05%
Mortgage Type
New Conventional
Purchase Details
Closed on
Jun 6, 2004
Sold by
Burleson T C Jr Etal
Bought by
Burleson Dennis F
Purchase Details
Closed on
Apr 24, 2001
Bought by
Burleson Adel R
Create a Home Valuation Report for This Property
The Home Valuation Report is an in-depth analysis detailing your home's value as well as a comparison with similar homes in the area
Home Values in the Area
Average Home Value in this Area
Purchase History
| Date | Buyer | Sale Price | Title Company |
|---|---|---|---|
| Burditt James E | $120,000 | -- | |
| Burleson Chase S | $90,000 | -- | |
| Burleson Dennis F | -- | -- | |
| Burleson T C Jr Etal | -- | -- | |
| Burleson Adel R | -- | -- |
Source: Public Records
Mortgage History
| Date | Status | Borrower | Loan Amount |
|---|---|---|---|
| Open | Burditt James E | $117,826 | |
| Previous Owner | Burleson Chase S | $90,000 |
Source: Public Records
Tax History Compared to Growth
Tax History
| Year | Tax Paid | Tax Assessment Tax Assessment Total Assessment is a certain percentage of the fair market value that is determined by local assessors to be the total taxable value of land and additions on the property. | Land | Improvement |
|---|---|---|---|---|
| 2025 | $1,553 | $49,048 | $5,960 | $43,088 |
| 2024 | $1,405 | $47,178 | $9,002 | $38,176 |
| 2023 | $1,405 | $47,178 | $9,002 | $38,176 |
| 2022 | $1,405 | $47,178 | $9,002 | $38,176 |
| 2021 | $1,003 | $30,908 | $9,002 | $21,906 |
| 2020 | $1,003 | $30,908 | $9,002 | $21,906 |
| 2019 | $972 | $30,908 | $9,002 | $21,906 |
| 2018 | $989 | $30,908 | $9,002 | $21,906 |
| 2017 | $990 | $30,908 | $9,002 | $21,906 |
| 2016 | $887 | $29,894 | $9,002 | $20,891 |
| 2015 | $889 | $29,894 | $9,002 | $20,891 |
| 2014 | $794 | $29,894 | $9,002 | $20,891 |
| 2013 | -- | $33,414 | $12,523 | $20,891 |
Source: Public Records
Map
Nearby Homes
- 114 Fortson Rd
- 46 Altapass Way
- 192 Morton Ct
- 39 Cypress Trail
- 49 Altapass Way
- 129 Hunter Rd
- 27 Altapass Way
- 277 Orchard Dr
- 11 Bristlecone Trail
- 31 Morus Ln
- 13 Morus Ln
- 470 Hamilton Mulberry Grove Rd
- 1159 James Rd
- 334 Orchard Dr
- 48 Hawthorne Terrace
- 33 Mt Olive Ln
- 0 Georgia 315
- 324 Grantham Dr
- 57 Hart Ridge Ct
- 235 Oak Grove Way
- 282 Mulberry Dr
- 282 Mulberry Dr Unit 49
- 274 Mulberry Dr
- 274 Mulberry Dr Unit 48
- 177 Cypress Trail
- 298 Mulberry Dr
- 298 Mulberry Dr Unit 51
- 146 Altapass Way
- 239 Fortson Rd
- 150 Mulberry Dr
- 79 Altapass Way
- 86 Altapass Way
- 67 Altapass Way
- 55 Altapass Way
- 66 Altapass Way
- 60 Altapass Way
- 37 Fortson Rd
- 52 Altapass Way
- Homesite 89 Mulberry Crossing Dr
- 84 Mulberry Dr