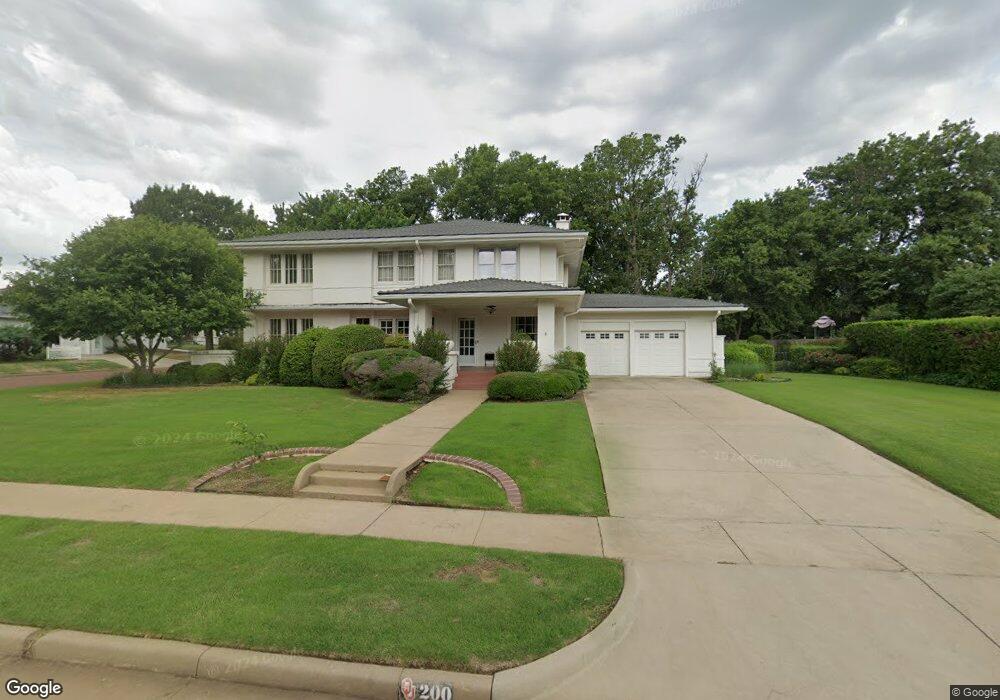
200 N 10th St Unit 140 Ponca City, OK 74601
Estimated Value: $166,000 - $237,186
3
Beds
2
Baths
3,486
Sq Ft
$56/Sq Ft
Est. Value
About This Home
This home is located at 200 N 10th St Unit 140, Ponca City, OK 74601 and is currently estimated at $196,797, approximately $56 per square foot. 200 N 10th St Unit 140 is a home located in Kay County with nearby schools including Roosevelt Elementary School, Ponca City East Middle School, and Ponca City West Middle School.
Ownership History
Date
Name
Owned For
Owner Type
Purchase Details
Closed on
Jan 15, 2025
Sold by
Charles W W and Charles Bayard S
Bought by
Casey Bayard S
Current Estimated Value
Home Financials for this Owner
Home Financials are based on the most recent Mortgage that was taken out on this home.
Original Mortgage
$117,000
Outstanding Balance
$116,154
Interest Rate
6.6%
Mortgage Type
New Conventional
Estimated Equity
$80,643
Purchase Details
Closed on
May 9, 2022
Sold by
Thomas Turner Travis
Bought by
Turner Austin Levi and Turner Heather Elizabeth
Purchase Details
Closed on
Aug 26, 1997
Sold by
Case Charles W and Case Bayard S
Bought by
Charles & Bayard Casey Tr
Purchase Details
Closed on
Jul 19, 1993
Sold by
Case Charles W and Case Bayard S
Bought by
Bayard S Casey
Create a Home Valuation Report for This Property
The Home Valuation Report is an in-depth analysis detailing your home's value as well as a comparison with similar homes in the area
Home Values in the Area
Average Home Value in this Area
Purchase History
| Date | Buyer | Sale Price | Title Company |
|---|---|---|---|
| Casey Bayard S | -- | Heritage Title | |
| Casey Bayard S | -- | Heritage Title | |
| Turner Austin Levi | $5,000 | None Listed On Document | |
| Charles & Bayard Casey Tr | -- | -- | |
| Bayard S Casey | -- | -- |
Source: Public Records
Mortgage History
| Date | Status | Borrower | Loan Amount |
|---|---|---|---|
| Open | Casey Bayard S | $117,000 | |
| Closed | Casey Bayard S | $117,000 |
Source: Public Records
Tax History Compared to Growth
Tax History
| Year | Tax Paid | Tax Assessment Tax Assessment Total Assessment is a certain percentage of the fair market value that is determined by local assessors to be the total taxable value of land and additions on the property. | Land | Improvement |
|---|---|---|---|---|
| 2024 | $1,536 | $17,227 | $2,024 | $15,203 |
| 2023 | $1,536 | $16,725 | $2,024 | $14,701 |
| 2022 | $1,450 | $16,238 | $2,024 | $14,214 |
| 2021 | $1,427 | $15,920 | $2,010 | $13,910 |
| 2020 | $1,368 | $15,457 | $1,990 | $13,467 |
| 2019 | $1,338 | $15,006 | $1,970 | $13,036 |
| 2018 | $1,314 | $14,570 | $1,913 | $12,657 |
| 2017 | $1,288 | $14,145 | $1,857 | $12,288 |
| 2016 | $1,261 | $13,733 | $1,803 | $11,930 |
| 2015 | $1,227 | $13,333 | $1,756 | $11,577 |
| 2014 | $1,166 | $12,945 | $1,265 | $11,680 |
Source: Public Records
Map
Nearby Homes
- 213 N 10th St
- 216 N 12th St Unit 840
- 202 N 7th St
- 310 N 7th St Unit 660
- 310 S 9th St
- 410 Drake Dr
- 409 N 5th St
- 525 Monument Rd
- 214 Virginia Ave
- 417 N 3rd St
- 701 S 8th St
- 408 S 4th St
- 800 S 12th St
- 106 Elmwood Ave
- 212 E Ponca Ave
- 417 S 2nd St
- 121 Hillside Ave
- 800 Sugar Maple Dr
- 4025 S Union St
- 920 N 4th St
- 210 N 10th St
- 911 E Cleveland Ave
- 120 N 10th St
- 903 E Cleveland Ave
- 205 N 10th St Unit 840
- 218 N 10th St
- 912 E Chestnut Ave
- 209 N 10th St Unit 840
- 201 N 10th St Unit 840
- 910 E Cleveland Ave
- 906 E Chestnut Ave
- 114 N 10th St
- 117 N 10th St
- 900 E Chestnut Ave
- 902 E Cleveland Ave
- 219 N 10th St
- 113 N 10th St
- 204 N 11th St
- 200 N 11th St Unit 840
- 208 N 11th St Unit 840