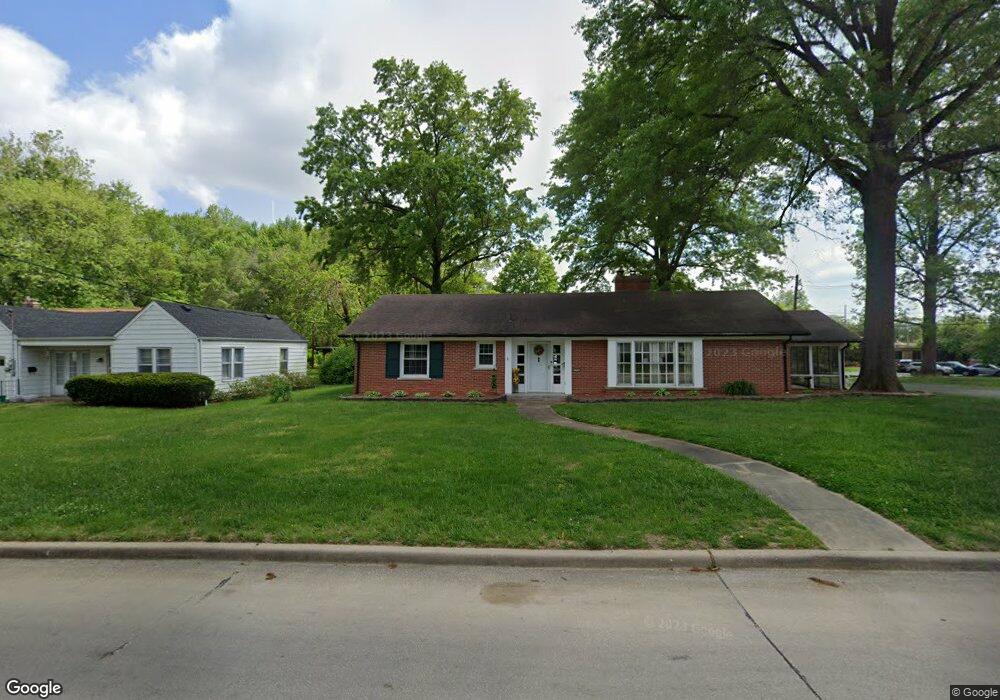
200 N 28th St Belleville, IL 62226
Estimated Value: $175,000 - $200,000
--
Bed
--
Bath
1,704
Sq Ft
$107/Sq Ft
Est. Value
About This Home
This home is located at 200 N 28th St, Belleville, IL 62226 and is currently estimated at $182,436, approximately $107 per square foot. 200 N 28th St is a home located in St. Clair County with nearby schools including Union Elementary School, West Jr High School, and Governor French Academy.
Ownership History
Date
Name
Owned For
Owner Type
Purchase Details
Closed on
Jun 21, 2004
Sold by
Meyer David J and Meyer Michael
Bought by
Meyer David J and Meyer Dorothy A
Current Estimated Value
Home Financials for this Owner
Home Financials are based on the most recent Mortgage that was taken out on this home.
Original Mortgage
$63,500
Interest Rate
6.46%
Mortgage Type
Purchase Money Mortgage
Purchase Details
Closed on
Mar 19, 2003
Sold by
Meyer June H
Bought by
Meyer David J and Meyer Michael
Create a Home Valuation Report for This Property
The Home Valuation Report is an in-depth analysis detailing your home's value as well as a comparison with similar homes in the area
Home Values in the Area
Average Home Value in this Area
Purchase History
| Date | Buyer | Sale Price | Title Company |
|---|---|---|---|
| Meyer David J | $60,000 | Chicago Title | |
| Meyer David J | -- | -- |
Source: Public Records
Mortgage History
| Date | Status | Borrower | Loan Amount |
|---|---|---|---|
| Closed | Meyer David J | $63,500 |
Source: Public Records
Tax History Compared to Growth
Tax History
| Year | Tax Paid | Tax Assessment Tax Assessment Total Assessment is a certain percentage of the fair market value that is determined by local assessors to be the total taxable value of land and additions on the property. | Land | Improvement |
|---|---|---|---|---|
| 2024 | $3,843 | $54,706 | $6,897 | $47,809 |
| 2023 | $2,644 | $47,058 | $6,760 | $40,298 |
| 2022 | $3,480 | $42,364 | $6,086 | $36,278 |
| 2021 | $3,307 | $39,165 | $5,626 | $33,539 |
| 2020 | $3,188 | $37,036 | $5,320 | $31,716 |
| 2019 | $3,571 | $40,471 | $5,329 | $35,142 |
| 2018 | $3,479 | $39,596 | $5,214 | $34,382 |
| 2017 | $1,751 | $39,318 | $5,177 | $34,141 |
| 2016 | $3,404 | $38,483 | $5,067 | $33,416 |
| 2014 | $1,647 | $41,615 | $7,561 | $34,054 |
| 2013 | $3,309 | $42,210 | $7,669 | $34,541 |
Source: Public Records
Map
Nearby Homes