Estimated Value: $494,410 - $538,000
--
Bed
--
Bath
1,510
Sq Ft
$337/Sq Ft
Est. Value
About This Home
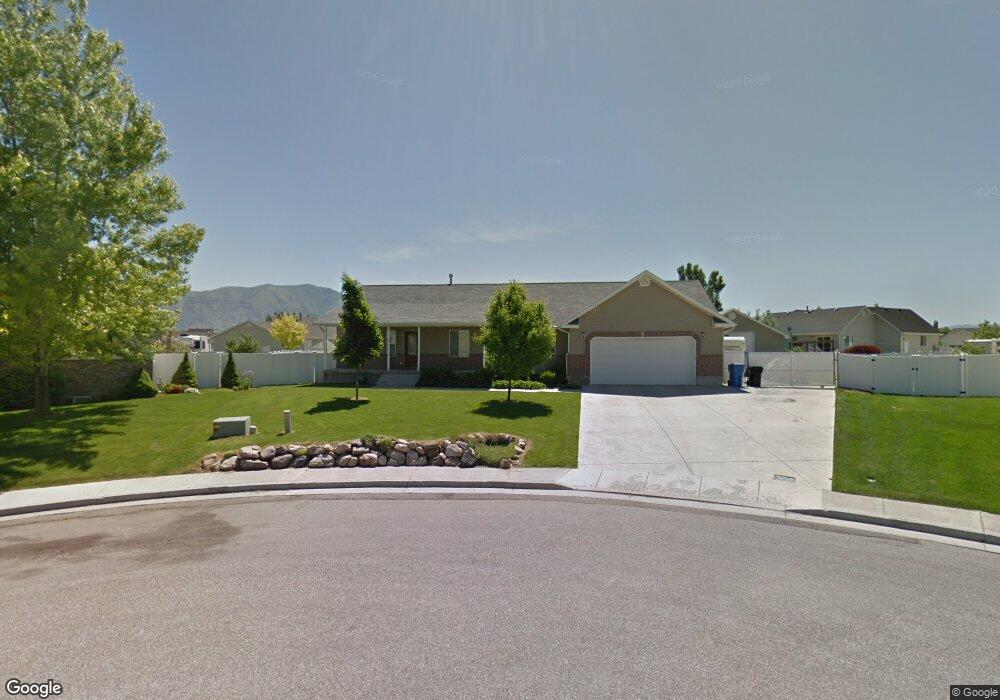
This home is located at 200 N 800 W Unit 48, Hyrum, UT 84319 and is currently estimated at $509,103, approximately $337 per square foot. 200 N 800 W Unit 48 is a home located in Cache County with nearby schools including Lincoln School, South Cache Middle School, and Mountain Crest High School.
Ownership History
Date
Name
Owned For
Owner Type
Purchase Details
Closed on
Aug 31, 2005
Sold by
Spillman Technologies Inc
Bought by
Douthit Cliff E
Current Estimated Value
Home Financials for this Owner
Home Financials are based on the most recent Mortgage that was taken out on this home.
Original Mortgage
$35,700
Outstanding Balance
$18,756
Interest Rate
5.76%
Mortgage Type
Stand Alone Second
Estimated Equity
$490,347
Purchase Details
Closed on
Aug 29, 2005
Sold by
Roberts Cory and Roberts Jana L
Bought by
Spillman Technologies Inc
Home Financials for this Owner
Home Financials are based on the most recent Mortgage that was taken out on this home.
Original Mortgage
$35,700
Outstanding Balance
$18,756
Interest Rate
5.76%
Mortgage Type
Stand Alone Second
Estimated Equity
$490,347
Create a Home Valuation Report for This Property
The Home Valuation Report is an in-depth analysis detailing your home's value as well as a comparison with similar homes in the area
Home Values in the Area
Average Home Value in this Area
Purchase History
| Date | Buyer | Sale Price | Title Company |
|---|---|---|---|
| Douthit Cliff E | -- | Cache Title Company | |
| Spillman Technologies Inc | -- | Cache Title Company |
Source: Public Records
Mortgage History
| Date | Status | Borrower | Loan Amount |
|---|---|---|---|
| Open | Douthit Cliff E | $35,700 | |
| Open | Douthit Cliff E | $142,800 | |
| Closed | Spillman Technologies Inc | $35,700 |
Source: Public Records
Tax History Compared to Growth
Tax History
| Year | Tax Paid | Tax Assessment Tax Assessment Total Assessment is a certain percentage of the fair market value that is determined by local assessors to be the total taxable value of land and additions on the property. | Land | Improvement |
|---|---|---|---|---|
| 2025 | $2,062 | $296,065 | $0 | $0 |
| 2024 | $2,016 | $270,380 | $0 | $0 |
| 2023 | $2,143 | $274,710 | $0 | $0 |
| 2022 | $2,236 | $274,710 | $0 | $0 |
| 2021 | $2,181 | $412,900 | $66,610 | $346,290 |
| 2020 | $1,604 | $284,949 | $66,610 | $218,339 |
| 2019 | $1,563 | $261,069 | $42,730 | $218,339 |
| 2018 | $1,440 | $232,590 | $42,730 | $189,860 |
| 2017 | $1,413 | $118,430 | $0 | $0 |
| 2016 | $1,445 | $118,430 | $0 | $0 |
| 2015 | $1,268 | $103,665 | $0 | $0 |
| 2014 | $1,278 | $106,840 | $0 | $0 |
| 2013 | -- | $106,840 | $0 | $0 |
Source: Public Records
Map
Nearby Homes
- 200 N 800 W
- 220 N 800 W Unit 49
- 220 N 800 W
- 185 N 800 W Unit 47
- 185 N 800 W
- 195 N 750 W
- 195 N 750 W Unit 32
- 770 W 150 N Unit 34
- 770 W 150 N
- 215 N 750 W
- 215 N 750 W Unit 31
- 780 W 150 N Unit 35
- 780 W 150 N
- 175 N 750 W
- 175 N 750 W Unit 33
- 235 N 750 W Unit 30
- 235 N 750 W
- 800 W 150 N Unit 36
- 244 N 800 W
- 777 W 250 N Unit 28