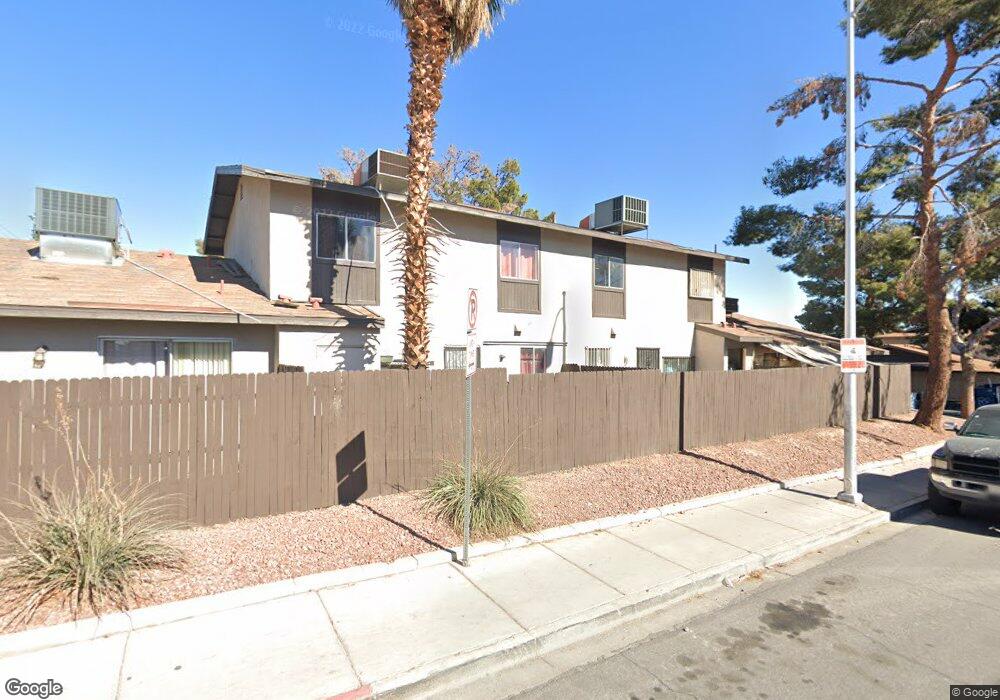
200 N Bruce St Unit C Las Vegas, NV 89101
Downtown Las Vegas NeighborhoodEstimated Value: $190,000 - $224,000
3
Beds
3
Baths
1,188
Sq Ft
$171/Sq Ft
Est. Value
About This Home
This home is located at 200 N Bruce St Unit C, Las Vegas, NV 89101 and is currently estimated at $202,965, approximately $170 per square foot. 200 N Bruce St Unit C is a home located in Clark County with nearby schools including Howard E Hollingsworth Elementary School, Roy West Martin Middle School, and Valley High School.
Ownership History
Date
Name
Owned For
Owner Type
Purchase Details
Closed on
Nov 7, 2020
Sold by
Nahoopii Bertha S J
Bought by
Bertha S J Nahoopii Revocable Living Trust and Nahoopii
Current Estimated Value
Purchase Details
Closed on
Sep 28, 2004
Sold by
Nahoopii Samuel P
Bought by
Nahoopii Bertha S J
Home Financials for this Owner
Home Financials are based on the most recent Mortgage that was taken out on this home.
Original Mortgage
$48,000
Interest Rate
5.77%
Mortgage Type
Unknown
Purchase Details
Closed on
Sep 15, 2004
Sold by
Chambers John William and Robinson Chambers Ilima M C
Bought by
Nahoopii Bertha S J
Home Financials for this Owner
Home Financials are based on the most recent Mortgage that was taken out on this home.
Original Mortgage
$48,000
Interest Rate
5.77%
Mortgage Type
Unknown
Purchase Details
Closed on
Aug 5, 2004
Sold by
Kawamitsu Sakae
Bought by
Chambers Ii John William and Robinson Chambers Ilima M C
Home Financials for this Owner
Home Financials are based on the most recent Mortgage that was taken out on this home.
Original Mortgage
$48,000
Interest Rate
5.77%
Mortgage Type
Unknown
Create a Home Valuation Report for This Property
The Home Valuation Report is an in-depth analysis detailing your home's value as well as a comparison with similar homes in the area
Home Values in the Area
Average Home Value in this Area
Purchase History
| Date | Buyer | Sale Price | Title Company |
|---|---|---|---|
| Bertha S J Nahoopii Revocable Living Trust | -- | None Listed On Document | |
| Nahoopii Bertha S J | -- | Chicago Title | |
| Nahoopii Bertha S J | $60,000 | Chicago Title | |
| Chambers Ii John William | $45,000 | Stewart Title Of Nevada |
Source: Public Records
Mortgage History
| Date | Status | Borrower | Loan Amount |
|---|---|---|---|
| Previous Owner | Nahoopii Bertha S J | $48,000 |
Source: Public Records
Tax History Compared to Growth
Tax History
| Year | Tax Paid | Tax Assessment Tax Assessment Total Assessment is a certain percentage of the fair market value that is determined by local assessors to be the total taxable value of land and additions on the property. | Land | Improvement |
|---|---|---|---|---|
| 2025 | $421 | $35,523 | $12,250 | $23,273 |
| 2024 | $391 | $35,523 | $12,250 | $23,273 |
| 2023 | $391 | $36,800 | $15,050 | $21,750 |
| 2022 | $362 | $33,209 | $12,250 | $20,959 |
| 2021 | $335 | $28,975 | $11,900 | $17,075 |
| 2020 | $309 | $26,864 | $8,750 | $18,114 |
| 2019 | $289 | $26,217 | $8,050 | $18,167 |
| 2018 | $276 | $22,085 | $4,550 | $17,535 |
| 2017 | $533 | $16,255 | $3,150 | $13,105 |
| 2016 | $260 | $15,113 | $3,150 | $11,963 |
| 2015 | $258 | $11,575 | $2,450 | $9,125 |
| 2014 | $250 | $8,367 | $2,100 | $6,267 |
Source: Public Records
Map
Nearby Homes
- 200 N Bruce St Unit A
- 217 N 18th St Unit C
- 208 N Bruce St Unit A
- 208 N Bruce St Unit C
- 241 N 19th St
- 1610 Stewart Ave
- 236 N 19th St
- 244 N 19th St
- 1601 Marlin Ave
- 209 N 21st St
- 2002 Marlin Ave
- 121 N 21st St
- 300 N 14th St
- 95 N 21st St
- 1708 Poplar Ave
- 223 Tower St
- 223 Dougram Ave
- 365 N 16th St
- 367 N 16th St
- 1905 Poplar Ave
- 200 N Bruce St Unit B
- 200 N Bruce St Unit D
- 200 N Bruce St Unit D
- 201 N 18th St Unit D
- 201 N 18th St Unit B
- 201 N 18th St Unit A
- 201 N 18th St Unit C
- 201 N 18th St
- 201 N Bruce St
- 209 N Bruce St
- 215 N Bruce St
- 1711 E Ogden Ave
- 219 N Bruce St
- 141 N Bruce St
- 1714 E Ogden Ave
- 233 N 18th St
- 209 N 18th St
- 240 N Bruce St
- 237 N 18th St
- 221 N 18th St