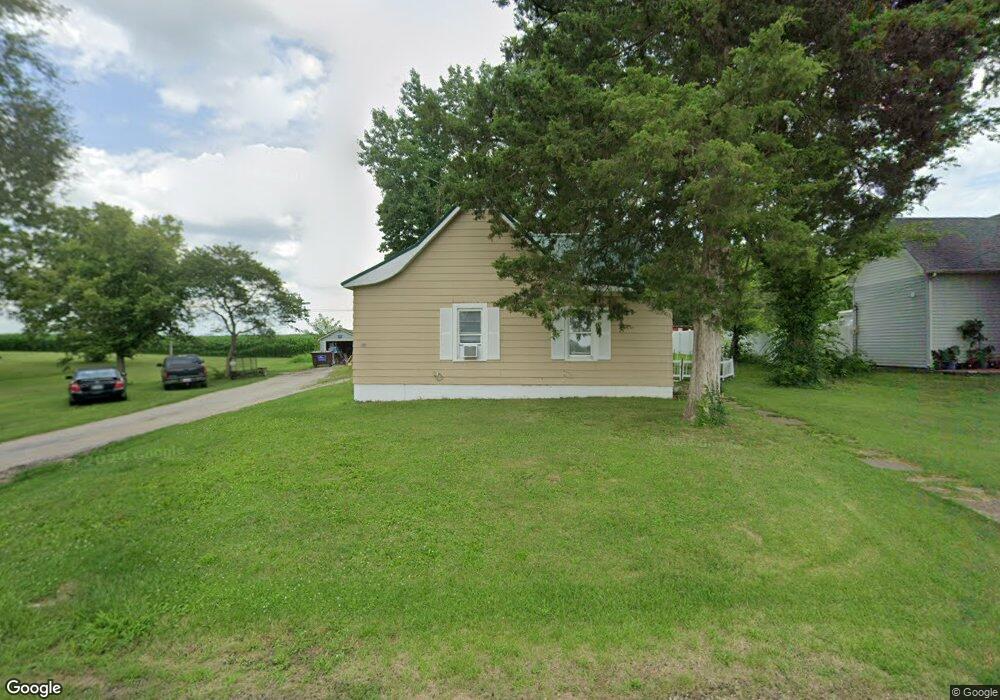
200 N East St Fillmore, IL 62032
Estimated Value: $61,661 - $209,000
3
Beds
1
Bath
1,370
Sq Ft
$82/Sq Ft
Est. Value
About This Home
This home is located at 200 N East St, Fillmore, IL 62032 and is currently estimated at $112,165, approximately $81 per square foot. 200 N East St is a home located in Montgomery County with nearby schools including North Elementary School and Nokomis Junior/Senior High School.
Ownership History
Date
Name
Owned For
Owner Type
Purchase Details
Closed on
Aug 10, 2018
Sold by
Sampson David E and Sampson Dawn R
Bought by
Tucker Shane A and Tucker Kandi M
Current Estimated Value
Home Financials for this Owner
Home Financials are based on the most recent Mortgage that was taken out on this home.
Original Mortgage
$48,484
Outstanding Balance
$42,106
Interest Rate
4.5%
Mortgage Type
New Conventional
Estimated Equity
$70,059
Purchase Details
Closed on
Dec 13, 2012
Sold by
Federal Home Loan Mortgage Corporation
Bought by
Sampson David E and Sampson Dawn R
Home Financials for this Owner
Home Financials are based on the most recent Mortgage that was taken out on this home.
Original Mortgage
$48,484
Interest Rate
4.5%
Mortgage Type
New Conventional
Purchase Details
Closed on
Jan 23, 2012
Sold by
Speed William E
Bought by
Federal Home Loan Mortgage Corporation
Purchase Details
Closed on
Jan 1, 2012
Bought by
Sampson David E
Create a Home Valuation Report for This Property
The Home Valuation Report is an in-depth analysis detailing your home's value as well as a comparison with similar homes in the area
Home Values in the Area
Average Home Value in this Area
Purchase History
| Date | Buyer | Sale Price | Title Company |
|---|---|---|---|
| Tucker Shane A | $45,000 | None Available | |
| Sampson David E | $5,000 | None Available | |
| Federal Home Loan Mortgage Corporation | -- | None Available | |
| Sampson David E | $33,500 | -- |
Source: Public Records
Mortgage History
| Date | Status | Borrower | Loan Amount |
|---|---|---|---|
| Open | Tucker Shane A | $48,484 | |
| Previous Owner | Sampson David E | $48,484 |
Source: Public Records
Tax History Compared to Growth
Tax History
| Year | Tax Paid | Tax Assessment Tax Assessment Total Assessment is a certain percentage of the fair market value that is determined by local assessors to be the total taxable value of land and additions on the property. | Land | Improvement |
|---|---|---|---|---|
| 2024 | $814 | $14,660 | $2,540 | $12,120 |
| 2023 | $743 | $13,780 | $2,390 | $11,390 |
| 2022 | $724 | $13,360 | $2,320 | $11,040 |
| 2021 | $324 | $9,210 | $2,190 | $7,020 |
| 2020 | $270 | $8,620 | $2,050 | $6,570 |
| 2019 | $240 | $8,290 | $1,970 | $6,320 |
| 2018 | $878 | $7,910 | $1,880 | $6,030 |
| 2017 | $887 | $7,670 | $1,820 | $5,850 |
| 2016 | $888 | $7,540 | $1,790 | $5,750 |
| 2015 | $875 | $7,660 | $1,820 | $5,840 |
| 2013 | $775 | $7,580 | $1,800 | $5,780 |
Source: Public Records
Map
Nearby Homes
- 000 E 24th Rd
- 456 E 2595 Ave
- 299 E 3050 Ave
- 106 Locust St
- TBD Red Ball Trail
- 0 Sec 29-7-1w Unit MIS25047631
- 102 3rd St
- 171 Red Ball Trail
- 694 E 2735 Ave
- 225 E 5th St
- 318 E 5th St
- 215 S Pine St
- 836 E 2650 Ave
- 2672 Us Highway 51
- Three Miles South of Nokomis
- 425 N Pine St
- 0
- 5 Remond St
- 1 Anchor Ave
- 9 Wood Duck Dr
- 264 E Ave E
- 118 N East St
- 115 N East St
- 214 N East St
- 217 N East St
- 605 E Fillmore St
- 519 E Fillmore St
- 214 N Richmond St
- 200 N Richmond St
- 521 E Walnut St
- 302 N East St
- 313 N East St
- 623 E Fillmore St
- 600 E Fillmore St
- 421 E North St
- 306 N Richmond St
- 516 E Fillmore St
- 312 N Richmond St
- 109 N Richmond St
- 612 E Fillmore St