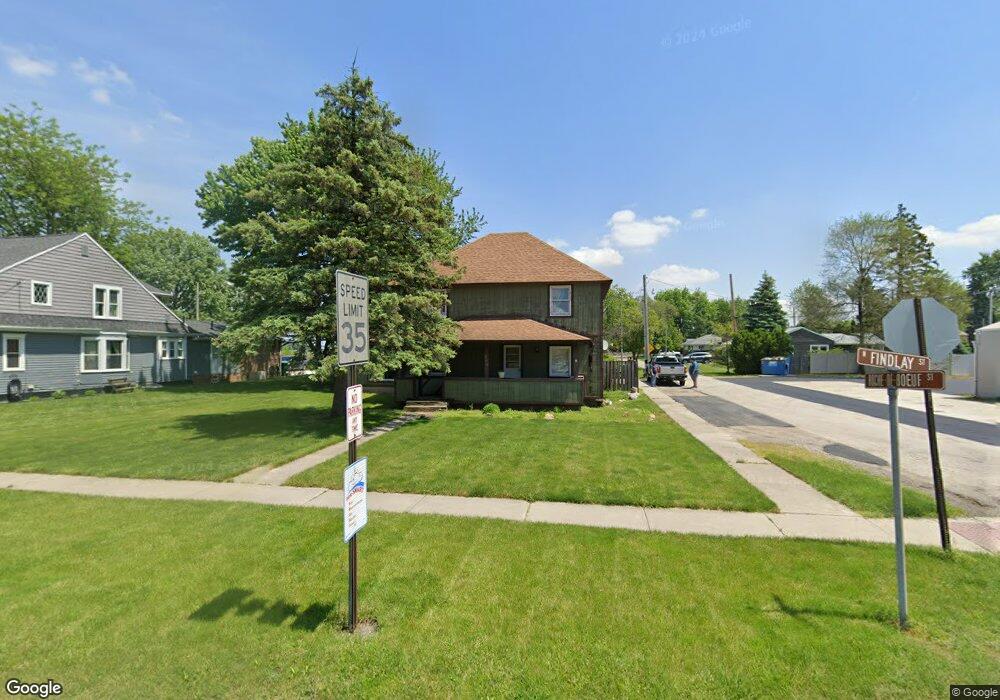
200 N Findlay Rd Haskins, OH 43525
Estimated Value: $178,000 - $295,000
3
Beds
2
Baths
1,776
Sq Ft
$128/Sq Ft
Est. Value
About This Home
This home is located at 200 N Findlay Rd, Haskins, OH 43525 and is currently estimated at $226,881, approximately $127 per square foot. 200 N Findlay Rd is a home located in Wood County with nearby schools including Otsego Elementary School, Otsego Junior High School, and Otsego High School.
Ownership History
Date
Name
Owned For
Owner Type
Purchase Details
Closed on
Oct 17, 2001
Sold by
Homecomings Financial Network Inc
Bought by
Delong Timothy D and Delong Sherry L
Current Estimated Value
Home Financials for this Owner
Home Financials are based on the most recent Mortgage that was taken out on this home.
Original Mortgage
$63,200
Outstanding Balance
$27,624
Interest Rate
8.5%
Estimated Equity
$199,257
Purchase Details
Closed on
Aug 31, 1988
Bought by
Banner Percy
Create a Home Valuation Report for This Property
The Home Valuation Report is an in-depth analysis detailing your home's value as well as a comparison with similar homes in the area
Home Values in the Area
Average Home Value in this Area
Purchase History
| Date | Buyer | Sale Price | Title Company |
|---|---|---|---|
| Delong Timothy D | $79,666 | American Title Agency | |
| Banner Percy | $69,000 | -- |
Source: Public Records
Mortgage History
| Date | Status | Borrower | Loan Amount |
|---|---|---|---|
| Open | Delong Timothy D | $63,200 | |
| Closed | Delong Timothy D | $15,800 |
Source: Public Records
Tax History Compared to Growth
Tax History
| Year | Tax Paid | Tax Assessment Tax Assessment Total Assessment is a certain percentage of the fair market value that is determined by local assessors to be the total taxable value of land and additions on the property. | Land | Improvement |
|---|---|---|---|---|
| 2024 | $1,951 | $41,615 | $6,755 | $34,860 |
| 2023 | $1,951 | $41,620 | $6,760 | $34,860 |
| 2021 | $1,814 | $35,530 | $5,990 | $29,540 |
| 2020 | $1,823 | $35,530 | $5,990 | $29,540 |
| 2019 | $1,681 | $31,470 | $5,990 | $25,480 |
| 2018 | $1,677 | $31,470 | $5,990 | $25,480 |
| 2017 | $1,593 | $31,470 | $5,990 | $25,480 |
| 2016 | $1,478 | $29,190 | $5,880 | $23,310 |
| 2015 | $1,478 | $29,190 | $5,880 | $23,310 |
| 2014 | $1,522 | $29,190 | $5,880 | $23,310 |
| 2013 | $1,575 | $27,790 | $5,600 | $22,190 |
Source: Public Records
Map
Nearby Homes
- 0 River Rd W
- 117 S 5th St
- 22 S 5th St
- 0 W River Rd Unit 6133310
- 0 W River Rd Unit 6134934
- 131 N River Rd
- 16600 Tyler Rd
- 214 N 2nd St
- 132 Wilkshire Dr
- 341 N River Rd
- 842 Cherry Ln
- 305 Ridgepoint Cir
- 13124 Devils Hole Rd
- 0 King Rd Unit 10000333
- 1371 Eastridge Dr
- 491 Patriot Dr W
- 28 Mattatuck Way
- 540 Independence Dr
- 792 Wilkshire Dr
- 25216 John F McCarthy Way
- 202 N Findlay Rd
- 202 N Findlay Rd Unit 173
- 0 Roche de Beouf St
- 0 Roche de Beouf St
- 206 N Findlay Rd
- 102 Roche de Beouf St
- 0 Findlay St
- 103 Roche de Boeuf
- 201 N Findlay Rd
- 201 N Findlay Rd
- 0 Findlay St
- 207 N Findlay Rd
- 0 Roche de Beouf St
- 105 Church
- 112 Church
- 116 Church
- 113 Sugar
- 208 N Findlay Rd
- 104 Roche de Beouf St
- 0 Roche de Beouf St