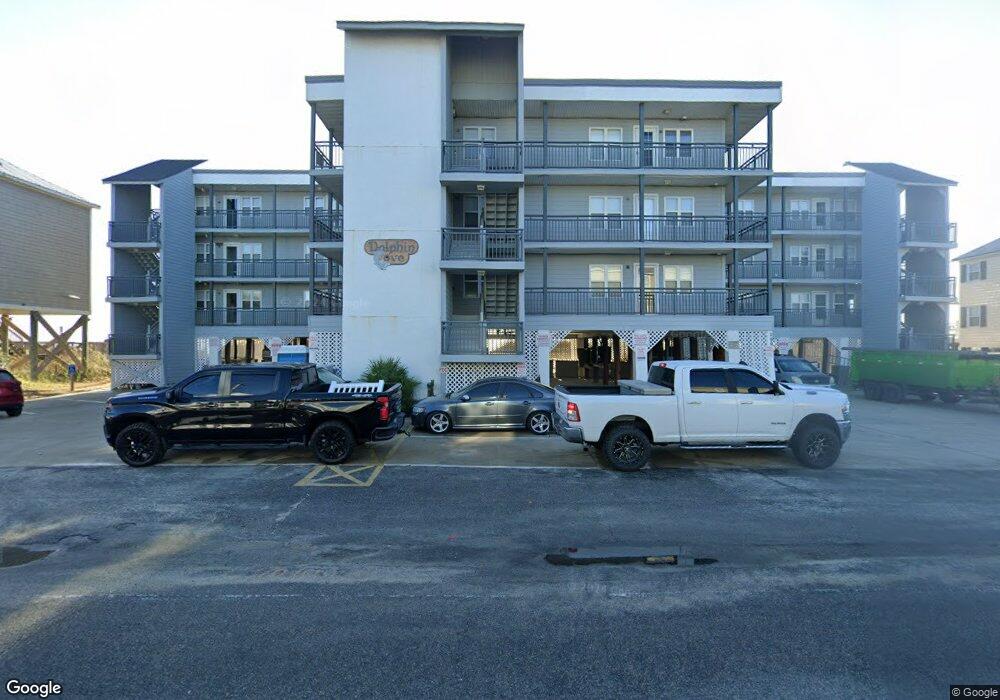
200 N Waccamaw Dr Unit 3E Dolphin Cove Murrells Inlet, SC 29576
Estimated Value: $474,000 - $704,000
3
Beds
3
Baths
1,100
Sq Ft
$500/Sq Ft
Est. Value
About This Home
This home is located at 200 N Waccamaw Dr Unit 3E Dolphin Cove, Murrells Inlet, SC 29576 and is currently estimated at $550,516, approximately $500 per square foot. 200 N Waccamaw Dr Unit 3E Dolphin Cove is a home located in Horry County with nearby schools including Seaside Elementary, St. James Middle School, and St. James Intermediate.
Ownership History
Date
Name
Owned For
Owner Type
Purchase Details
Closed on
Mar 22, 2021
Sold by
Newland Andrew G
Bought by
Murray Steven H and Murray Tamara A
Current Estimated Value
Home Financials for this Owner
Home Financials are based on the most recent Mortgage that was taken out on this home.
Original Mortgage
$65,000
Outstanding Balance
$58,366
Interest Rate
2.8%
Mortgage Type
New Conventional
Estimated Equity
$492,150
Purchase Details
Closed on
Jan 29, 2016
Sold by
Hudson George A
Bought by
Newland Andrew G
Purchase Details
Closed on
Apr 14, 2012
Sold by
Montgomery Russell M
Bought by
Hudson George A
Purchase Details
Closed on
Jun 25, 2001
Sold by
Ann Runyans Patricia
Bought by
Montgomery Russell M and Montgomery Linda C
Home Financials for this Owner
Home Financials are based on the most recent Mortgage that was taken out on this home.
Original Mortgage
$170,000
Interest Rate
7.17%
Mortgage Type
Unknown
Create a Home Valuation Report for This Property
The Home Valuation Report is an in-depth analysis detailing your home's value as well as a comparison with similar homes in the area
Home Values in the Area
Average Home Value in this Area
Purchase History
| Date | Buyer | Sale Price | Title Company |
|---|---|---|---|
| Murray Steven H | $325,000 | -- | |
| Newland Andrew G | $250,000 | -- | |
| Hudson George A | $250,000 | -- | |
| Montgomery Russell M | $189,000 | -- |
Source: Public Records
Mortgage History
| Date | Status | Borrower | Loan Amount |
|---|---|---|---|
| Open | Murray Steven H | $65,000 | |
| Previous Owner | Montgomery Russell M | $170,000 |
Source: Public Records
Tax History Compared to Growth
Tax History
| Year | Tax Paid | Tax Assessment Tax Assessment Total Assessment is a certain percentage of the fair market value that is determined by local assessors to be the total taxable value of land and additions on the property. | Land | Improvement |
|---|---|---|---|---|
| 2024 | $4,795 | $31,914 | $0 | $31,914 |
| 2023 | $4,795 | $30,450 | $0 | $30,450 |
| 2021 | $4,116 | $30,450 | $0 | $30,450 |
| 2020 | $3,401 | $30,450 | $0 | $30,450 |
| 2019 | $3,401 | $30,450 | $0 | $30,450 |
| 2018 | $0 | $25,725 | $0 | $25,725 |
| 2017 | $3,050 | $14,700 | $0 | $14,700 |
| 2016 | -- | $13,800 | $0 | $13,800 |
| 2015 | $623 | $24,150 | $0 | $24,150 |
| 2014 | $542 | $13,800 | $0 | $13,800 |
Source: Public Records
Map
Nearby Homes
- 156 Garden City Retreat Dr
- 125 Garden City Retreat Dr
- 221 N Waccamaw Dr
- 126 N Waccamaw Dr Unit 101
- 126 N Waccamaw Dr Unit 203 Sand Dollar
- 301 N Waccamaw Dr Unit 108 Garden Sands
- 301 N Waccamaw Dr Unit 205
- 301 N Waccamaw Dr Unit 211 GARDEN SANDS
- 100 N Waccamaw Dr
- 320 N Waccamaw Dr Unit 3B
- 120 Dogwood Dr N Unit 209
- 120 Dogwood Dr N Unit 113
- 120 Dogwood Dr N Unit 314 Garden City Gues
- 123 Yaupon Ave
- 340 N Waccamaw Dr Unit 201
- 225-B N Dogwood Dr Unit Garden City Beach
- 116 S Waccamaw Dr Unit 204 Duneside III
- 116 S Waccamaw Dr Unit 207
- 215 Atlantic Ave Unit 104 Sea Watch Inn at
- 131 Cypress Ave
- 200 N Waccamaw Dr Unit 3-D
- 200 N Waccamaw Dr Unit 1-D Dolphin Cove
- 200 N Waccamaw Dr Unit 3-D Dolphin Cove
- 200 N Waccamaw Dr Unit Dolphin Cove 3-D
- 200 N Waccamaw Dr Unit 3-A Dolphin Cove
- 200 N Waccamaw Dr Unit 1A
- 200 N Waccamaw Dr Unit 2A
- 200 N Waccamaw Dr Unit 3-A
- 200 N Waccamaw Dr Unit 1-D
- 200 N Waccamaw Dr Unit 3E
- 214 N Waccamaw Dr
- 136 N Waccamaw Dr Unit Sea Dreams
- 136 N Waccamaw Dr
- 157 Garden City Retreat Dr Unit N. Waccamaw Dr. & Ma
- 156 Garden City Retreat Dr Unit N. Waccamaw Dr. & Ma
- 156 Garden City Retreat Dr Unit Hip Nautic
- 157 Garden City Retreat Dr Unit Lot 15
- 156 Garden City Retreat Dr Unit LOT 14 Retreat Garde
- 125 Garden City Retreat Dr Unit N. Waccamaw Dr. & Ma
- 125 Garden City Retreat Dr Unit 7 The Retreat @ Gard