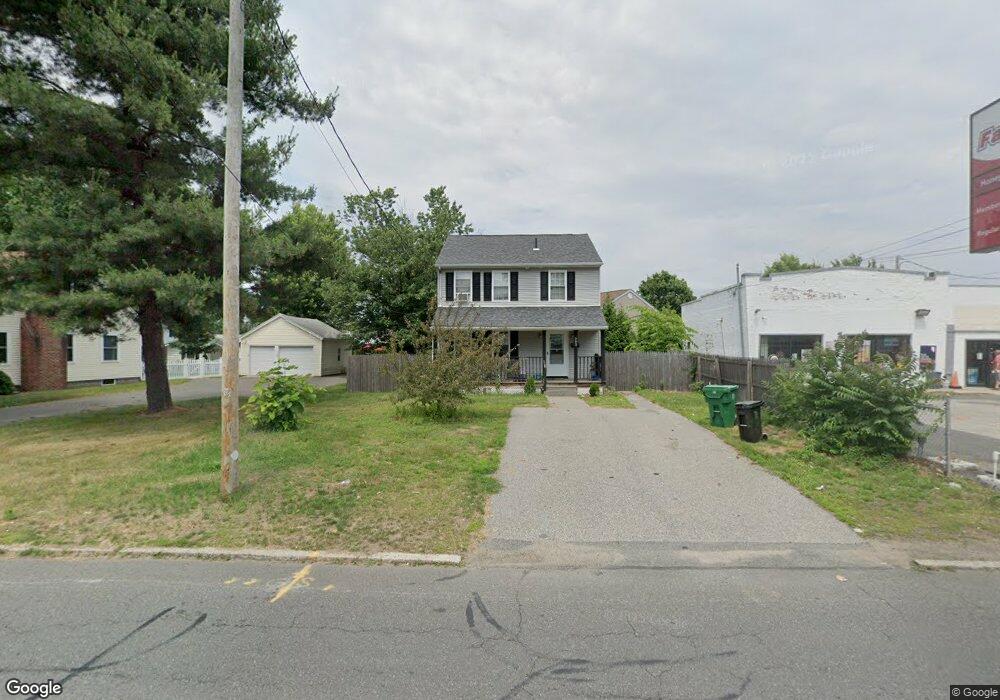
200 Newbury St Unit 10 Chicopee, MA 01013
Chicopee Center NeighborhoodEstimated Value: $312,000 - $336,189
3
Beds
3
Baths
1,288
Sq Ft
$253/Sq Ft
Est. Value
About This Home
This home is located at 200 Newbury St Unit 10, Chicopee, MA 01013 and is currently estimated at $325,547, approximately $252 per square foot. 200 Newbury St Unit 10 is a home located in Hampden County with nearby schools including Bowe Elementary School, Fairview Middle School, and Chicopee High School.
Ownership History
Date
Name
Owned For
Owner Type
Purchase Details
Closed on
Jun 19, 2015
Sold by
Negron Steven G and Negron Tracy L
Bought by
Lafleur Ryan P
Current Estimated Value
Home Financials for this Owner
Home Financials are based on the most recent Mortgage that was taken out on this home.
Original Mortgage
$170,050
Outstanding Balance
$131,849
Interest Rate
3.78%
Mortgage Type
New Conventional
Estimated Equity
$193,698
Purchase Details
Closed on
Nov 2, 2007
Sold by
Rik Mar Realty Result
Bought by
Negron Steven G and Negron Tracy L
Home Financials for this Owner
Home Financials are based on the most recent Mortgage that was taken out on this home.
Original Mortgage
$179,500
Interest Rate
6.43%
Mortgage Type
Purchase Money Mortgage
Purchase Details
Closed on
Sep 28, 2005
Sold by
Sighinolfi Alyce and Hendry Anne M
Bought by
Rik & Mar Rlty Result Ll
Home Financials for this Owner
Home Financials are based on the most recent Mortgage that was taken out on this home.
Original Mortgage
$220,000
Interest Rate
5.84%
Mortgage Type
Purchase Money Mortgage
Create a Home Valuation Report for This Property
The Home Valuation Report is an in-depth analysis detailing your home's value as well as a comparison with similar homes in the area
Home Values in the Area
Average Home Value in this Area
Purchase History
| Date | Buyer | Sale Price | Title Company |
|---|---|---|---|
| Lafleur Ryan P | $179,000 | -- | |
| Negron Steven G | $179,500 | -- | |
| Rik & Mar Rlty Result Ll | $60,000 | -- |
Source: Public Records
Mortgage History
| Date | Status | Borrower | Loan Amount |
|---|---|---|---|
| Open | Lafleur Ryan P | $170,050 | |
| Previous Owner | Negron Steven G | $179,500 | |
| Previous Owner | Rik & Mar Rlty Result Ll | $220,000 |
Source: Public Records
Tax History Compared to Growth
Tax History
| Year | Tax Paid | Tax Assessment Tax Assessment Total Assessment is a certain percentage of the fair market value that is determined by local assessors to be the total taxable value of land and additions on the property. | Land | Improvement |
|---|---|---|---|---|
| 2025 | $4,537 | $299,300 | $78,400 | $220,900 |
| 2024 | $4,341 | $294,100 | $76,900 | $217,200 |
| 2023 | $4,015 | $265,000 | $69,900 | $195,100 |
| 2022 | $3,952 | $232,600 | $60,800 | $171,800 |
| 2021 | $5,001 | $221,100 | $55,200 | $165,900 |
| 2020 | $3,450 | $204,000 | $55,200 | $148,800 |
| 2019 | $3,484 | $194,000 | $55,200 | $138,800 |
| 2018 | $4,596 | $184,800 | $52,600 | $132,200 |
| 2017 | $3,038 | $175,500 | $52,600 | $122,900 |
| 2016 | $2,888 | $170,800 | $52,600 | $118,200 |
| 2015 | $3,115 | $177,600 | $52,600 | $125,000 |
| 2014 | -- | $177,600 | $52,600 | $125,000 |
Source: Public Records
Map
Nearby Homes
- 26 Leeds St
- 30 Athol St
- 572 Springfield St
- 2 Marion St
- Lot 1 Marion St
- 1078 Liberty St
- 103 Ontario St
- 320 Fairview Ave
- 596-598 Newbury St
- 74 David St
- 11 Calvin St
- 57- 59 Stearns Terrace
- 11 Leroy Place
- 37 Kennedy St
- 195 Mildred Ave
- 231 Wheatland Ave
- 193 Roy St
- 31 Denton Cir
- 92 Miller St
- 882-884 Liberty St
- 200 Newbury St
- 190 Newbury St
- 190 Newbury St Unit 1
- 206 Newbury St
- 24 Gilbert Ave
- 11 Leeds St
- 201 Newbury St
- 185 Newbury St
- 203 Newbury St
- 184 Newbury St
- 17 Gilbert Ave
- 179 Newbury St
- 218 Newbury St
- 11 Gilbert Ave
- 185 Rimmon Ave
- 5 Glenwood St
- 170 Farnsworth St
- 185 Farnsworth St
- 16 Leeds St
- 40 Gilbert Ave