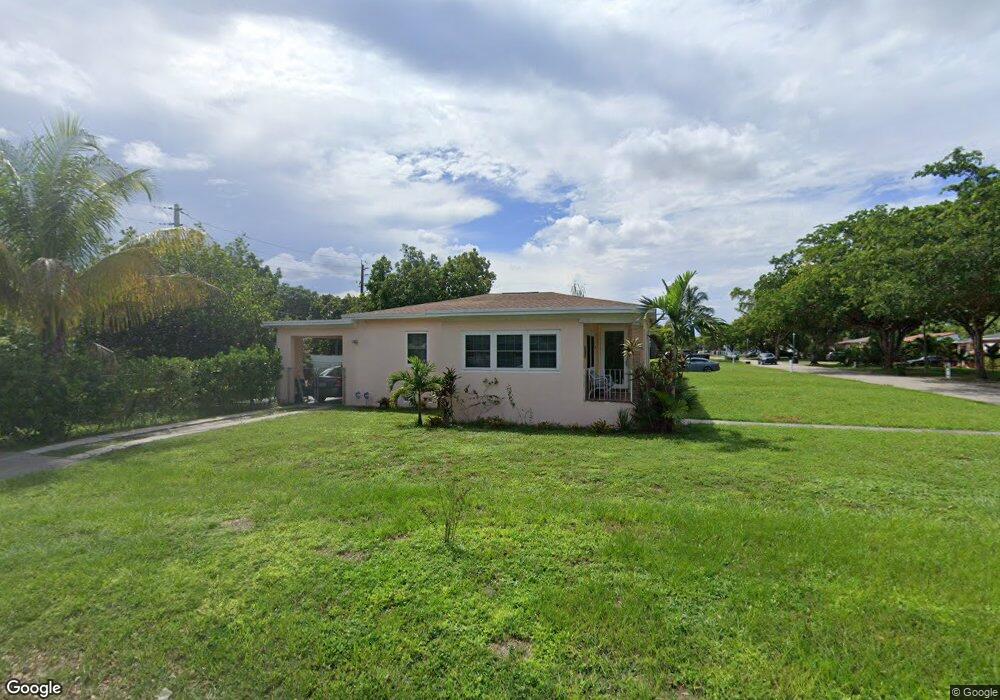
200 NW 126th St North Miami, FL 33168
Alhambra Heights NeighborhoodEstimated Value: $446,000 - $520,000
2
Beds
1
Bath
1,001
Sq Ft
$471/Sq Ft
Est. Value
About This Home
This home is located at 200 NW 126th St, North Miami, FL 33168 and is currently estimated at $471,167, approximately $470 per square foot. 200 NW 126th St is a home located in Miami-Dade County with nearby schools including Gratigny Elementary School, Thomas Jefferson Middle School, and North Miami Senior High School.
Ownership History
Date
Name
Owned For
Owner Type
Purchase Details
Closed on
Apr 7, 2017
Sold by
Woolever Bruce and Woolever Victoria M Moreira
Bought by
Woolever Bruce and Woolever Victoria M Moreira
Current Estimated Value
Purchase Details
Closed on
Oct 12, 2007
Sold by
Woolever Bruce and Woolever Rose
Bought by
Woolever Bruce Melven
Purchase Details
Closed on
Jun 3, 2003
Sold by
Glenford John and Augustine John
Bought by
Woolever Bruce and Woolever Rose
Home Financials for this Owner
Home Financials are based on the most recent Mortgage that was taken out on this home.
Original Mortgage
$120,000
Interest Rate
5.2%
Mortgage Type
Unknown
Purchase Details
Closed on
Nov 27, 1995
Sold by
Estevez Karin I Miller
Bought by
John Glenford
Home Financials for this Owner
Home Financials are based on the most recent Mortgage that was taken out on this home.
Original Mortgage
$2,680
Interest Rate
7.48%
Mortgage Type
Balloon
Create a Home Valuation Report for This Property
The Home Valuation Report is an in-depth analysis detailing your home's value as well as a comparison with similar homes in the area
Home Values in the Area
Average Home Value in this Area
Purchase History
| Date | Buyer | Sale Price | Title Company |
|---|---|---|---|
| Woolever Bruce | $38,200 | Attorney | |
| Woolever Bruce Melven | -- | Attorney | |
| Woolever Bruce | $120,000 | Alliance Title Of South Flor | |
| John Glenford | $67,000 | -- | |
| Miller Karen I | $100 | -- |
Source: Public Records
Mortgage History
| Date | Status | Borrower | Loan Amount |
|---|---|---|---|
| Previous Owner | Woolever Bruce | $120,000 | |
| Previous Owner | Miller Karen I | $2,680 |
Source: Public Records
Tax History Compared to Growth
Tax History
| Year | Tax Paid | Tax Assessment Tax Assessment Total Assessment is a certain percentage of the fair market value that is determined by local assessors to be the total taxable value of land and additions on the property. | Land | Improvement |
|---|---|---|---|---|
| 2025 | $2,583 | $90,347 | -- | -- |
| 2024 | $2,532 | $87,801 | -- | -- |
| 2023 | $2,532 | $85,244 | $0 | $0 |
| 2022 | $2,574 | $82,762 | $0 | $0 |
| 2021 | $2,551 | $80,352 | $0 | $0 |
| 2020 | $2,530 | $79,243 | $0 | $0 |
| 2019 | $2,491 | $77,462 | $0 | $0 |
| 2018 | $2,408 | $74,239 | $0 | $0 |
| 2017 | $2,413 | $73,258 | $0 | $0 |
| 2016 | $2,419 | $71,752 | $0 | $0 |
| 2015 | $761 | $71,254 | $0 | $0 |
| 2014 | $774 | $70,689 | $0 | $0 |
Source: Public Records
Map
Nearby Homes
- 210 NW 126th St
- 175 NW 125th St
- 315 NW 127th St
- 395 NW 124th St
- 12625 NW 1st Ct
- 155 NW 124th St
- 125 NW 127th St
- 395 NW 123rd St
- 140 NW 124th St
- 85 NW 126th St
- 12260 NW 1st Ct
- 12245 NW 2nd Ave
- 12900 NW 1st Ct
- 45 NW 127th St
- 40 NW 125th St
- 425 NW 122nd St
- 125 NW 122nd St
- 125 NW 121st St
- 12680 N Miami Ave
- 13025 NW 1st Ct
- 226 126ave
- 220 NW 126th St Unit B
- 220 NW 126th St
- 215 NW 125th St
- 205 NW 125th St
- 12555 NW 2nd Ave
- 12575 NW 2nd Ave
- 12525 NW 2nd Ave
- 205 NW 126th St
- 215 NW 126th St
- 12605 NW 2nd Ave
- 225 NW 125th St
- 230 NW 126th St
- 12625 NW 2nd Ave
- 225 NW 126th St
- 235 NW 125th St
- 12600 NW 1st Ct
- 12655 NW 2nd Ave
- 160 NW 126th St