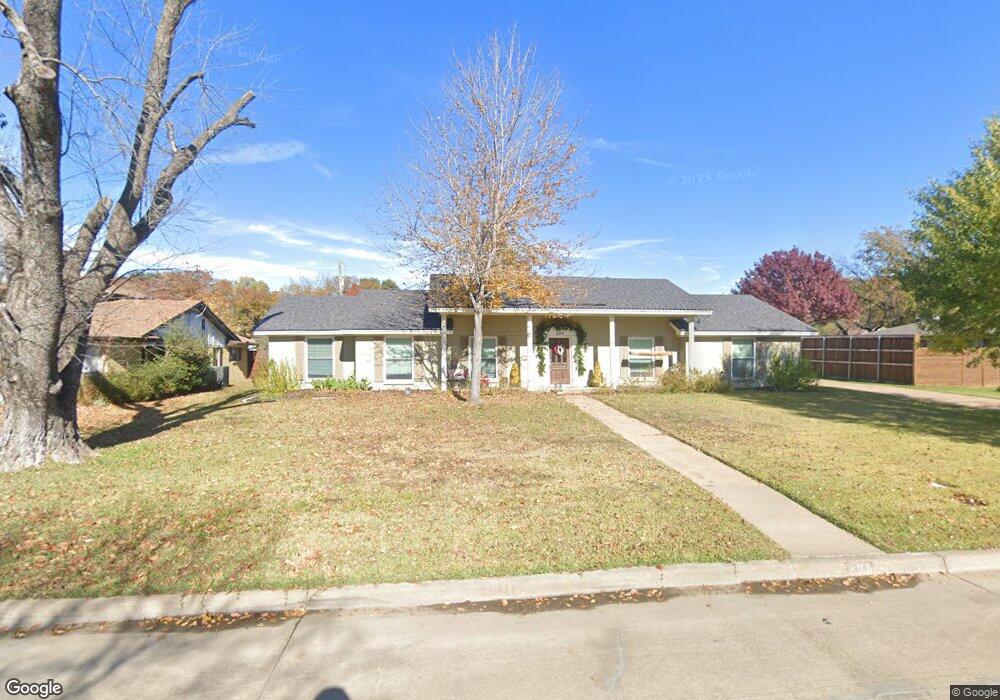
200 Oak Valley Dr Colleyville, TX 76034
Estimated Value: $697,000 - $768,000
4
Beds
3
Baths
2,239
Sq Ft
$327/Sq Ft
Est. Value
About This Home
This home is located at 200 Oak Valley Dr, Colleyville, TX 76034 and is currently estimated at $732,358, approximately $327 per square foot. 200 Oak Valley Dr is a home located in Tarrant County with nearby schools including Bransford Elementary School, Colleyville Middle School, and Grapevine High School.
Ownership History
Date
Name
Owned For
Owner Type
Purchase Details
Closed on
Aug 17, 2016
Sold by
Connell Dennis O and Connell Cindy L O
Bought by
Rosser James B and Rosser Laura
Current Estimated Value
Home Financials for this Owner
Home Financials are based on the most recent Mortgage that was taken out on this home.
Original Mortgage
$324,000
Outstanding Balance
$147,815
Interest Rate
3.41%
Mortgage Type
New Conventional
Estimated Equity
$584,543
Purchase Details
Closed on
Jun 29, 2012
Sold by
Weaver H Dewitt and Weaver Mary C
Bought by
Oconnell Dennis and Oconnell Cindy L
Home Financials for this Owner
Home Financials are based on the most recent Mortgage that was taken out on this home.
Original Mortgage
$204,232
Interest Rate
3.75%
Mortgage Type
FHA
Purchase Details
Closed on
Mar 28, 2007
Sold by
Weaver H Dewitt and Weaver Mary C
Bought by
Weaver H Dewitt and Weaver Mary C
Create a Home Valuation Report for This Property
The Home Valuation Report is an in-depth analysis detailing your home's value as well as a comparison with similar homes in the area
Home Values in the Area
Average Home Value in this Area
Purchase History
| Date | Buyer | Sale Price | Title Company |
|---|---|---|---|
| Rosser James B | -- | Itc | |
| Oconnell Dennis | -- | None Available | |
| Weaver H Dewitt | -- | None Available |
Source: Public Records
Mortgage History
| Date | Status | Borrower | Loan Amount |
|---|---|---|---|
| Open | Rosser James B | $324,000 | |
| Previous Owner | Oconnell Dennis | $204,232 |
Source: Public Records
Tax History Compared to Growth
Tax History
| Year | Tax Paid | Tax Assessment Tax Assessment Total Assessment is a certain percentage of the fair market value that is determined by local assessors to be the total taxable value of land and additions on the property. | Land | Improvement |
|---|---|---|---|---|
| 2025 | $2,295 | $643,505 | $264,475 | $379,030 |
| 2024 | $2,295 | $643,505 | $264,475 | $379,030 |
| 2023 | $8,642 | $667,230 | $264,475 | $402,755 |
| 2022 | $9,198 | $572,680 | $264,475 | $308,205 |
| 2021 | $9,298 | $437,224 | $178,950 | $258,274 |
| 2020 | $8,553 | $393,489 | $178,950 | $214,539 |
| 2019 | $8,090 | $371,995 | $178,950 | $193,045 |
| 2018 | $1,891 | $318,105 | $178,950 | $139,155 |
| 2017 | $8,505 | $360,000 | $178,950 | $181,050 |
| 2016 | $5,039 | $309,989 | $175,950 | $134,039 |
| 2015 | $4,295 | $193,900 | $50,000 | $143,900 |
| 2014 | $4,295 | $193,900 | $50,000 | $143,900 |
Source: Public Records
Map
Nearby Homes
- 203 Oak Valley Dr
- 217 Oak Valley Dr
- 5609 Oak Top Dr
- 407 Timberline Dr N
- 200 Valley View Dr N
- 5902 Preston Way
- 2116 Cottage Oak Ln
- 5913 Preston Way
- 112 Glade Rd
- 5104 Shadowood Rd
- 114 Glade Rd
- 1921 Maplewood Trail
- 5800 Hunter Trail
- 34 Piazza Ln Unit 37
- 37 Piazza Ln
- 613 Colts Neck Ct
- 621 Trails End Ct
- 3412 Glade Creek Dr
- 5803 Chalford Common
- 4600 Bransford Rd
- 112 Oak Valley Dr
- 204 Oak Valley Dr
- 108 Oak Valley Dr
- 111 Oak Valley Dr
- 205 Oak Valley Dr
- 208 Oak Valley Dr
- 109 Oak Valley Dr
- 209 Oak Valley Dr
- 104 Oak Valley Dr
- 212 Oak Valley Dr
- 105 Oak Valley Dr
- 213 Oak Valley Dr
- 100 Oak Valley Dr
- 201 Oak Crest Hill Dr
- 113 Oak Crest Hill Dr
- 205 Oak Crest Hill Dr
- 101 Oak Valley Dr
- 216 Oak Valley Dr
- 109 Oak Crest Hill Dr
- 209 Oak Crest Hill Dr