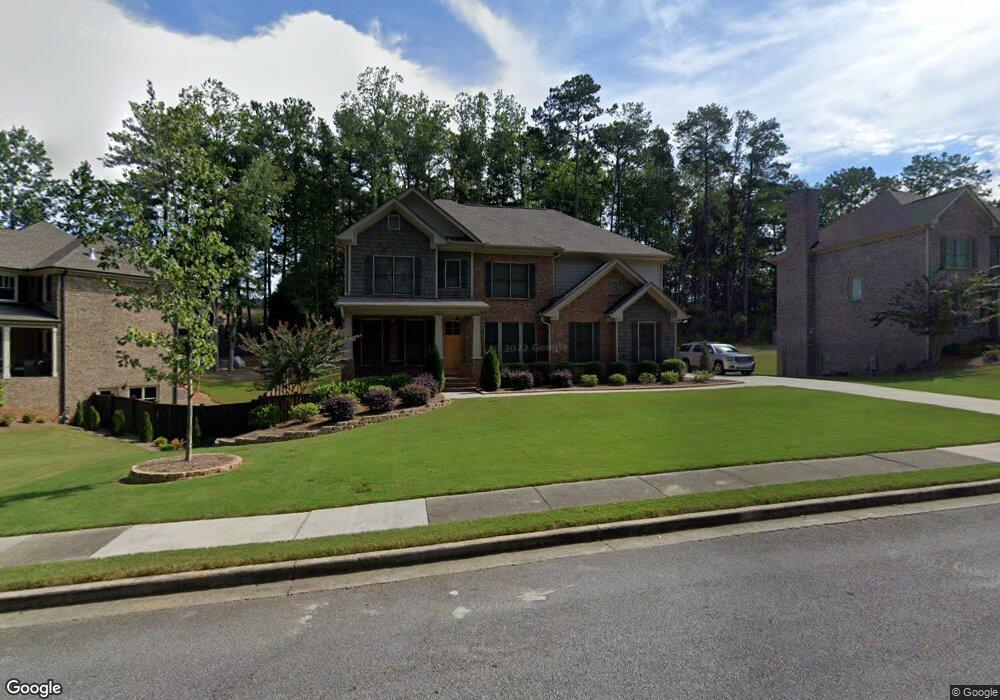
200 Parkview Trace Pass SW Unit PASS Lilburn, GA 30047
Estimated Value: $671,000 - $708,313
5
Beds
4
Baths
2,980
Sq Ft
$233/Sq Ft
Est. Value
About This Home
This home is located at 200 Parkview Trace Pass SW Unit PASS, Lilburn, GA 30047 and is currently estimated at $695,578, approximately $233 per square foot. 200 Parkview Trace Pass SW Unit PASS is a home located in Gwinnett County with nearby schools including Arcado Elementary School, Trickum Middle School, and Parkview High School.
Ownership History
Date
Name
Owned For
Owner Type
Purchase Details
Closed on
Jul 27, 2016
Sold by
Nolan Builders Inc
Bought by
Chung Eunjin and Kim Hyeon
Current Estimated Value
Home Financials for this Owner
Home Financials are based on the most recent Mortgage that was taken out on this home.
Original Mortgage
$414,000
Outstanding Balance
$328,528
Interest Rate
3.48%
Mortgage Type
New Conventional
Estimated Equity
$367,050
Purchase Details
Closed on
Apr 29, 2015
Sold by
Yellow Fever Grp Llc
Bought by
Nolan Builders Inc
Purchase Details
Closed on
Nov 4, 2014
Sold by
Bailey Morris
Bought by
Yellow Fever Grp Llc
Create a Home Valuation Report for This Property
The Home Valuation Report is an in-depth analysis detailing your home's value as well as a comparison with similar homes in the area
Home Values in the Area
Average Home Value in this Area
Purchase History
| Date | Buyer | Sale Price | Title Company |
|---|---|---|---|
| Chung Eunjin | $460,000 | -- | |
| Nolan Builders Inc | $290,000 | -- | |
| Yellow Fever Grp Llc | -- | -- | |
| Yellow Fever Grp Llc | $125,000 | -- |
Source: Public Records
Mortgage History
| Date | Status | Borrower | Loan Amount |
|---|---|---|---|
| Open | Chung Eunjin | $414,000 |
Source: Public Records
Tax History Compared to Growth
Tax History
| Year | Tax Paid | Tax Assessment Tax Assessment Total Assessment is a certain percentage of the fair market value that is determined by local assessors to be the total taxable value of land and additions on the property. | Land | Improvement |
|---|---|---|---|---|
| 2025 | $10,867 | $340,160 | $30,000 | $310,160 |
| 2024 | $9,137 | $282,000 | $30,000 | $252,000 |
| 2023 | $9,137 | $225,160 | $31,600 | $193,560 |
| 2022 | $6,541 | $225,160 | $31,600 | $193,560 |
| 2021 | $5,805 | $174,520 | $31,600 | $142,920 |
| 2020 | $6,622 | $174,520 | $31,600 | $142,920 |
| 2019 | $6,606 | $174,520 | $31,600 | $142,920 |
| 2018 | $6,632 | $174,520 | $31,600 | $142,920 |
| 2016 | $885 | $23,600 | $23,600 | $0 |
| 2015 | $896 | $23,600 | $23,600 | $0 |
| 2014 | -- | $23,600 | $23,600 | $0 |
Source: Public Records
Map
Nearby Homes
- 222 Black Birch Pass
- 5041 Cricket Ct SW
- 140 Cross Creek Dr
- 4983 Arcado Rd SW
- 90 Cross Creek Dr
- 248 Kettlewood Dr SW
- 50 Bailey Dr SW
- 5265 Sunset Maple Trail Unit 3
- 4989 Woodfall Dr SW
- 4879 Joy Ln SW
- 5221 La Paloma Dr SW Unit 1
- 311 Arbor Point Ct SW
- 551 Briggs Cir SW
- 4909 Woodfall Dr SW
- 215 Hauteur Place SW
- 574 Horseshoe Cir SW
- 200 Parkview Trace Pass SW Unit 3
- 200 Parkview Trace Pass SW
- 200 Parkview Trace Pass SW
- 190 Parkview Trace Pass SW Unit 4
- 190 Parkview Trace Pass SW
- 210 Parkview Trace Pass SW
- 210 Parkview Trace Pass SW Unit PASS
- 180 Parkview Trace Pass SW
- 220 Parkview Trace Pass SW Unit PASS
- 220 Parkview Trace Pass SW
- 5288 Browning Way SW Unit 1
- 5073 Arcado Rd SW
- 0 Parkview Trace Pass SW Unit 8380034
- 0 Parkview Trace Pass SW Unit 9048774
- 0 Parkview Trace Pass SW Unit 8781791
- 0 Parkview Trace Pass SW Unit 7455892
- 0 Parkview Trace Pass SW
- 160 Parkview Trace Pass SW
- 5268 Browning Way SW
- 5268 Browing Way