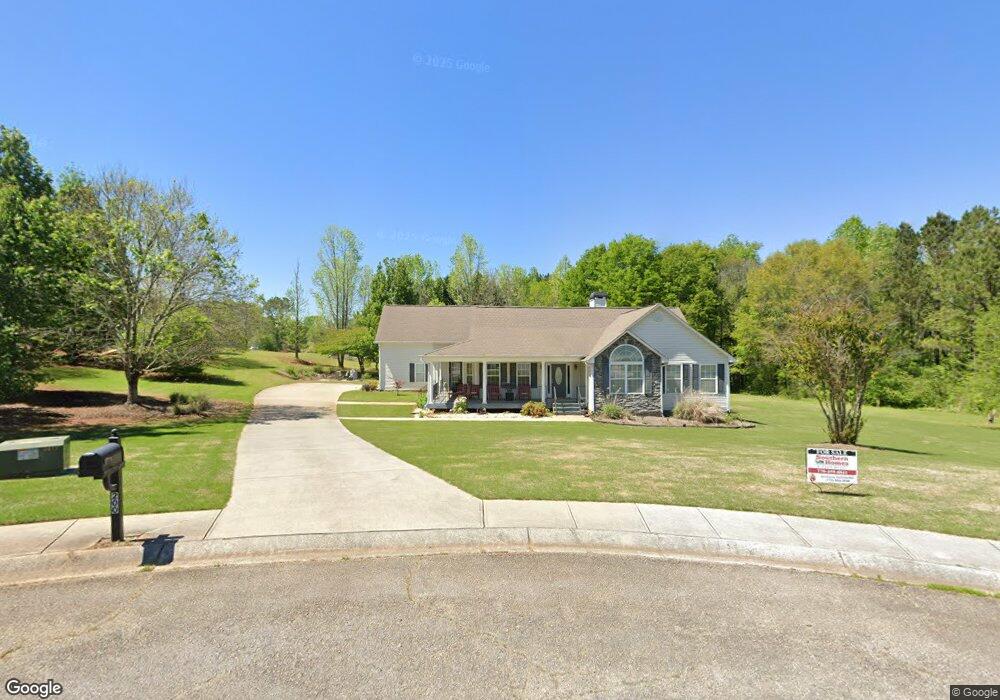
200 Point Ridge Ct Temple, GA 30179
Abilene NeighborhoodEstimated Value: $384,662 - $433,000
3
Beds
3
Baths
2,602
Sq Ft
$157/Sq Ft
Est. Value
About This Home
This home is located at 200 Point Ridge Ct, Temple, GA 30179 and is currently estimated at $409,416, approximately $157 per square foot. 200 Point Ridge Ct is a home located in Carroll County with nearby schools including Sharp Creek Elementary School, Bay Springs Middle School, and Villa Rica High School.
Ownership History
Date
Name
Owned For
Owner Type
Purchase Details
Closed on
Jun 9, 2025
Sold by
Owens Staci L
Bought by
Peters Ronald W
Current Estimated Value
Home Financials for this Owner
Home Financials are based on the most recent Mortgage that was taken out on this home.
Original Mortgage
$299,596
Outstanding Balance
$299,339
Interest Rate
6.76%
Mortgage Type
FHA
Estimated Equity
$110,077
Purchase Details
Closed on
Apr 17, 2019
Sold by
Sito Anthony T
Bought by
Owens Staci L and Peters Ronald W
Home Financials for this Owner
Home Financials are based on the most recent Mortgage that was taken out on this home.
Original Mortgage
$202,215
Interest Rate
4.2%
Mortgage Type
New Conventional
Purchase Details
Closed on
Aug 6, 2004
Sold by
Westside Development Inc
Bought by
Sito Anthony T and Sito Samantha G
Purchase Details
Closed on
Nov 25, 2003
Sold by
West Ridge Land Development Ll
Bought by
Westside Development Inc
Purchase Details
Closed on
Aug 5, 2003
Sold by
West Ridge Land Development Ll
Bought by
West Ridge Land Development Llc
Purchase Details
Closed on
Jan 7, 2003
Sold by
Westside Dev Inc
Bought by
West Ridge Land Development Llc
Purchase Details
Closed on
Aug 12, 2002
Bought by
Westside Dev Inc
Create a Home Valuation Report for This Property
The Home Valuation Report is an in-depth analysis detailing your home's value as well as a comparison with similar homes in the area
Home Values in the Area
Average Home Value in this Area
Purchase History
| Date | Buyer | Sale Price | Title Company |
|---|---|---|---|
| Peters Ronald W | -- | -- | |
| Owens Staci L | $237,900 | -- | |
| Sito Anthony T | $188,400 | -- | |
| Westside Development Inc | -- | -- | |
| West Ridge Land Development Llc | -- | -- | |
| West Ridge Land Development Llc | -- | -- | |
| Westside Dev Inc | -- | -- |
Source: Public Records
Mortgage History
| Date | Status | Borrower | Loan Amount |
|---|---|---|---|
| Open | Peters Ronald W | $299,596 | |
| Previous Owner | Owens Staci L | $198,000 | |
| Previous Owner | Owens Staci L | $200,350 | |
| Previous Owner | Owens Staci L | $202,215 | |
| Previous Owner | Sito Anthony T | $136,000 |
Source: Public Records
Tax History
| Year | Tax Paid | Tax Assessment Tax Assessment Total Assessment is a certain percentage of the fair market value that is determined by local assessors to be the total taxable value of land and additions on the property. | Land | Improvement |
|---|---|---|---|---|
| 2025 | $928 | $155,443 | $10,000 | $145,443 |
| 2024 | $3,516 | $155,443 | $10,000 | $145,443 |
| 2023 | $3,516 | $142,200 | $10,000 | $132,200 |
| 2022 | $2,911 | $116,049 | $10,000 | $106,049 |
| 2021 | $2,585 | $100,848 | $10,000 | $90,848 |
| 2020 | $2,329 | $90,753 | $10,000 | $80,753 |
| 2019 | $1,887 | $83,229 | $10,000 | $73,229 |
| 2018 | $1,602 | $66,190 | $10,000 | $56,190 |
| 2017 | $1,607 | $66,190 | $10,000 | $56,190 |
| 2016 | $1,608 | $66,190 | $10,000 | $56,190 |
| 2015 | $1,625 | $62,107 | $10,000 | $52,108 |
| 2014 | $1,632 | $62,108 | $10,000 | $52,108 |
Source: Public Records
Map
Nearby Homes
- 184 Ridge Crossing
- 301 Spruill Bridge Rd
- 252 Spruill Bridge Rd
- 1620 Bar J Rd
- 291 Buckhorn Dr
- 656 Paynes Lake Rd
- 435 Paynes Lake Rd
- 415 Paynes Lake Rd
- 155 Bass Lake Dr
- 365 Lovell Rd
- 250 Sandhill Hickory Level Rd
- 000 Happy Hollow Rd
- 0 Happy Hollow Rd Unit 10679464
- 0 Happy Hollow Rd Unit 10702081
- 528 Clinton Dr
- 408 Reagan Dr
- 566 Clinton Dr
- 108 Villa Rosa Ridge
- 339 Roy Morgan Rd
- 159 Villa Rosa Ridge
- 204 Point Ridge Ct
- 201 Point Ridge Ct
- 309 N Ridge Ln
- 0 Point Ridge and Ridge N Unit 7136324
- 305 N Ridge Ln
- 189 Ridge Crossing
- 173 Ridge Crossing
- 301 N Ridge Ln
- 208 Point Ridge Ct
- 312 N Ridge Ln
- 165 Ridge Crossing
- 300 N Ridge Ln
- 316 N Ridge Ln
- 209 Point Ridge Ct
- 206 Shackleford Rd
- 308 N Ridge Ln
- 304 N Ridge Ln
- 324 N Ridge Ln
- 160 Ridge Crossing
- 212 Point Ridge Ct
Your Personal Tour Guide
Ask me questions while you tour the home.