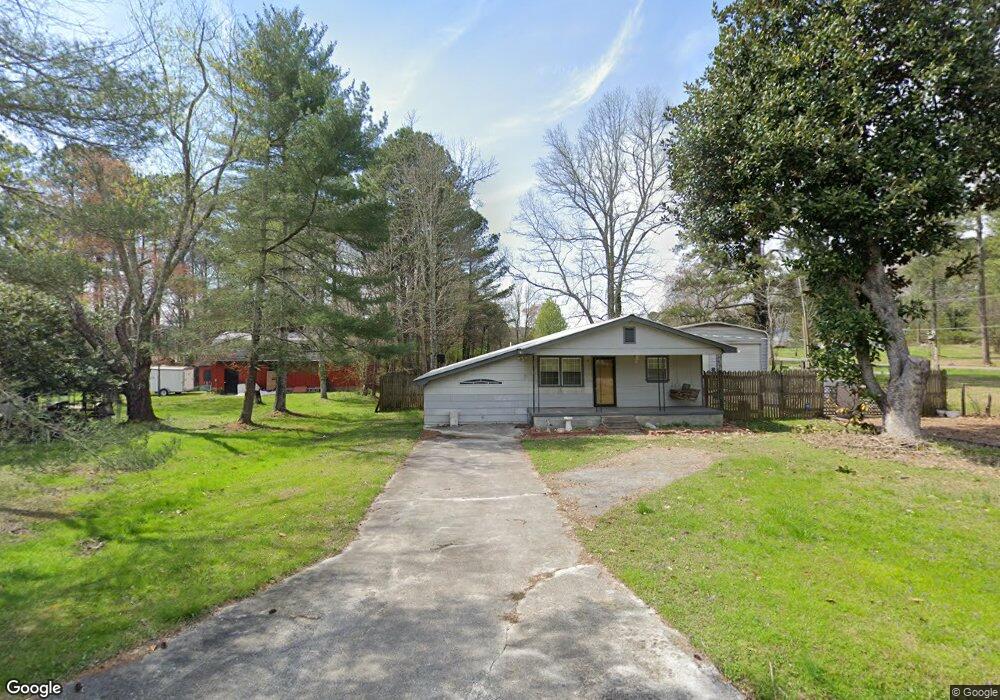
200 Ramage Ave La Fayette, GA 30728
Estimated Value: $128,000 - $158,000
2
Beds
1
Bath
800
Sq Ft
$187/Sq Ft
Est. Value
About This Home
This home is located at 200 Ramage Ave, La Fayette, GA 30728 and is currently estimated at $149,202, approximately $186 per square foot. 200 Ramage Ave is a home located in Walker County with nearby schools including North Lafayette Elementary School, Lafayette Middle School, and Lafayette High School.
Ownership History
Date
Name
Owned For
Owner Type
Purchase Details
Closed on
Nov 28, 2017
Sold by
Ronzie Carroll
Bought by
Ronzie Carroll
Current Estimated Value
Purchase Details
Closed on
Dec 10, 2002
Sold by
Carroll Ronzie
Bought by
Carroll Ronzie
Purchase Details
Closed on
Oct 26, 1998
Sold by
Dalrymple Anthony J
Bought by
Carroll Ronzie
Purchase Details
Closed on
Feb 3, 1994
Sold by
Stancel Katherine L and Stancel Anthony
Bought by
Dalrymple Anthony J
Purchase Details
Closed on
May 21, 1993
Sold by
Stancel Alvin J and Stancel Katherine
Bought by
Stancel Katherine L and Stancel Anthony
Purchase Details
Closed on
Feb 10, 1984
Sold by
Moore Joe T and Moore Florence H
Bought by
Stancel Alvin J and Stancel Katherine
Purchase Details
Closed on
Jul 23, 1981
Sold by
Winton Douglas E and Wf Gloria
Bought by
Moore Joe T and Moore Florence H
Purchase Details
Closed on
Jun 14, 1979
Sold by
Adams Alvin P
Bought by
Winton Douglas E and Wf Gloria
Purchase Details
Closed on
May 30, 1978
Bought by
Adams Alvin P
Create a Home Valuation Report for This Property
The Home Valuation Report is an in-depth analysis detailing your home's value as well as a comparison with similar homes in the area
Home Values in the Area
Average Home Value in this Area
Purchase History
| Date | Buyer | Sale Price | Title Company |
|---|---|---|---|
| Ronzie Carroll | -- | -- | |
| Carroll Ronzie | -- | -- | |
| Carroll Ronzie | $42,100 | -- | |
| Dalrymple Anthony J | -- | -- | |
| Stancel Katherine L | $34,400 | -- | |
| Stancel Alvin J | -- | -- | |
| Moore Joe T | -- | -- | |
| Winton Douglas E | -- | -- | |
| Adams Alvin P | -- | -- |
Source: Public Records
Tax History Compared to Growth
Tax History
| Year | Tax Paid | Tax Assessment Tax Assessment Total Assessment is a certain percentage of the fair market value that is determined by local assessors to be the total taxable value of land and additions on the property. | Land | Improvement |
|---|---|---|---|---|
| 2024 | $859 | $36,156 | $1,326 | $34,830 |
| 2023 | $841 | $34,544 | $1,326 | $33,218 |
| 2022 | $792 | $30,228 | $1,326 | $28,902 |
| 2021 | $615 | $20,400 | $1,326 | $19,074 |
| 2020 | $564 | $17,756 | $1,326 | $16,430 |
| 2019 | $573 | $17,756 | $1,326 | $16,430 |
| 2018 | $470 | $17,756 | $1,326 | $16,430 |
| 2017 | $565 | $17,756 | $1,326 | $16,430 |
| 2016 | $565 | $17,756 | $1,326 | $16,430 |
| 2015 | $669 | $20,691 | $1,264 | $19,427 |
| 2014 | $587 | $20,691 | $1,264 | $19,427 |
| 2013 | $470 | $20,691 | $1,264 | $19,427 |
Source: Public Records
Map
Nearby Homes
- 71 McCarter Rd
- 0 N Highway 27 Unit RTC2680391
- 0 N Highway 27 Unit 1395752
- 1520 N Main St
- 10 Acres S Maddox Gap Rd
- 474 Lake Howard Rd
- 3032 Lake Howard Rd
- 105 Stanfield Rd
- 1403 N Main St
- 232 Gordon Pond Rd
- 197 Old Warren School Rd
- 217 Old Warren School Rd
- 253 Old Warren School Rd
- 239 Old Warren School Rd
- 164 Old Warren School Rd
- 154 Old Warren School Rd
- 144 Old Warren School Rd
- 1318 Fernwood Dr
- 393 Wisteria Rd
- 1314 Fernwood Dr