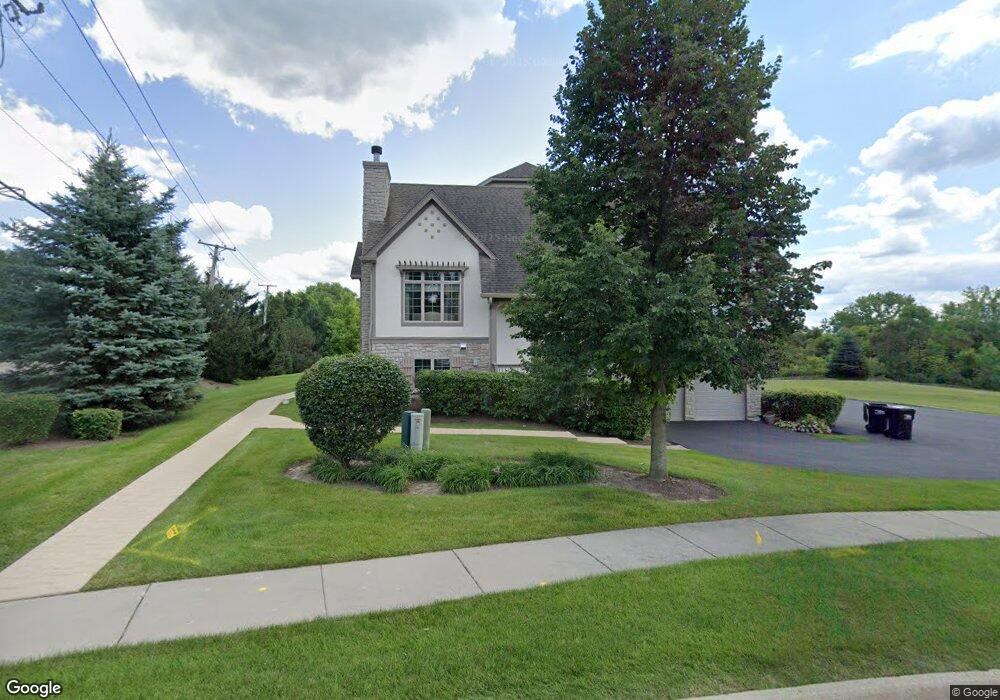
200 Regency Ct Unit F Wauconda, IL 60084
Estimated Value: $305,000 - $387,000
2
Beds
3
Baths
2,003
Sq Ft
$166/Sq Ft
Est. Value
About This Home
This home is located at 200 Regency Ct Unit F, Wauconda, IL 60084 and is currently estimated at $333,407, approximately $166 per square foot. 200 Regency Ct Unit F is a home located in Lake County with nearby schools including Wauconda Grade School, Wauconda Middle School, and Wauconda High School.
Ownership History
Date
Name
Owned For
Owner Type
Purchase Details
Closed on
Dec 5, 2019
Sold by
Speer Richard M and Speer Wanda
Bought by
Speer Richard M and Speer Wanda J
Current Estimated Value
Purchase Details
Closed on
Nov 28, 2017
Sold by
Ehas Michael A and Estate Of Janet H Ehas
Bought by
Speer Richard M and Speer Wanda
Home Financials for this Owner
Home Financials are based on the most recent Mortgage that was taken out on this home.
Original Mortgage
$199,405
Outstanding Balance
$169,208
Interest Rate
4.25%
Mortgage Type
New Conventional
Estimated Equity
$164,199
Purchase Details
Closed on
May 31, 2012
Sold by
Wauconda Regency Llc
Bought by
Ehas Janet
Home Financials for this Owner
Home Financials are based on the most recent Mortgage that was taken out on this home.
Original Mortgage
$176,000
Interest Rate
3.75%
Mortgage Type
Assumption
Create a Home Valuation Report for This Property
The Home Valuation Report is an in-depth analysis detailing your home's value as well as a comparison with similar homes in the area
Home Values in the Area
Average Home Value in this Area
Purchase History
| Date | Buyer | Sale Price | Title Company |
|---|---|---|---|
| Speer Richard M | -- | Attorney | |
| Speer Richard M | $209,900 | Heritage Title Company | |
| Ehas Janet | $110,500 | None Available |
Source: Public Records
Mortgage History
| Date | Status | Borrower | Loan Amount |
|---|---|---|---|
| Open | Speer Richard M | $199,405 | |
| Closed | Ehas Janet | $176,000 |
Source: Public Records
Tax History
| Year | Tax Paid | Tax Assessment Tax Assessment Total Assessment is a certain percentage of the fair market value that is determined by local assessors to be the total taxable value of land and additions on the property. | Land | Improvement |
|---|---|---|---|---|
| 2024 | $6,502 | $84,589 | $6,417 | $78,172 |
| 2023 | $6,502 | $77,321 | $5,866 | $71,455 |
| 2022 | $7,671 | $79,294 | $5,797 | $73,497 |
| 2021 | $7,322 | $74,926 | $5,478 | $69,448 |
| 2020 | $7,080 | $71,412 | $5,221 | $66,191 |
| 2019 | $6,264 | $67,490 | $4,934 | $62,556 |
| 2018 | $7,196 | $71,162 | $7,081 | $64,081 |
| 2017 | $7,246 | $70,339 | $6,999 | $63,340 |
| 2016 | $6,742 | $66,609 | $6,628 | $59,981 |
| 2015 | $7,011 | $61,149 | $6,085 | $55,064 |
| 2014 | $6,306 | $55,226 | $7,446 | $47,780 |
| 2012 | $28 | $56,221 | $7,580 | $48,641 |
Source: Public Records
Map
Nearby Homes
- 225 Regency Ct Unit A
- 255 Regency Ct Unit D
- 255 Regency Ct Unit C
- 245 Regency Ct Unit B
- 245 Regency Ct Unit E
- 159 Parkview Dr Unit 159
- 285 Regency Court Unit B Ct
- 214 Minerva Ave
- 450 N Main St Unit S208A
- 610 Larkdale Row
- 124 Hubbard Ct
- 28855 N Garland Rd
- 0 Bonner Rd
- 29564 N Garland Rd
- 155 E Mill St Unit 8
- 818 Sheridan Dr
- 28722 N Madison Ave
- 1114 Jackson Ave
- 227 Kimball Ave
- 501 E Liberty St
- 200 Regency Ct Unit 1-2
- 200 Regency Ct Unit 1-4
- 200 Regency Ct Unit 1-3
- 200 Regency Ct Unit 200D
- 200 Regency Ct Unit 1-6
- 200 Regency Ct Unit B
- 200 Regency Ct Unit E
- 200 Regency Ct Unit A
- 200 Regency Ct Unit D
- 200 Regency Ct Unit C
- 200 Regency Ct Unit E
- 200 Regency Ct Unit 2-1
- 225 Regency Ct
- 134 Parkview Dr Unit 4134
- 132 Parkview Dr Unit 4132
- 220B Regency Ct Unit 3-2
- 130 Parkview Dr Unit 4130
- 128 Parkview Dr Unit 4128
- 220A Regency Ct Unit 3-1
- 220A Regency Ct Unit 220A
Your Personal Tour Guide
Ask me questions while you tour the home.