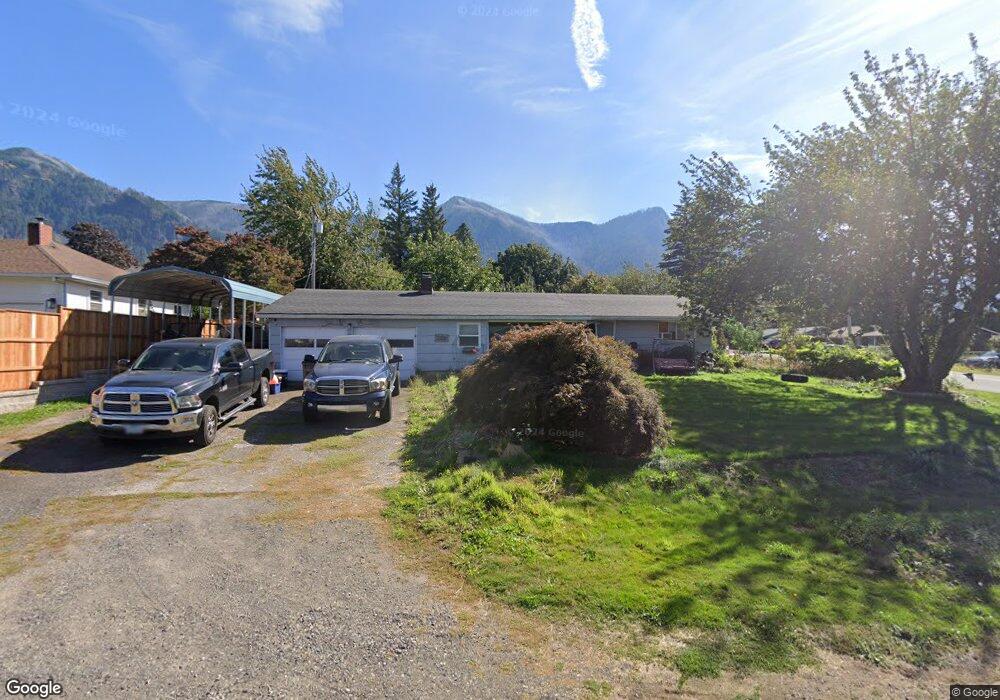
200 Riverview Cascade Locks, OR 97014
Estimated Value: $354,000 - $417,046
3
Beds
2
Baths
1,340
Sq Ft
$288/Sq Ft
Est. Value
About This Home
This home is located at 200 Riverview, Cascade Locks, OR 97014 and is currently estimated at $385,523, approximately $287 per square foot. 200 Riverview is a home located in Hood River County with nearby schools including Cascade Locks School, Hood River Middle School, and Hood River Valley High School.
Ownership History
Date
Name
Owned For
Owner Type
Purchase Details
Closed on
Feb 5, 2018
Sold by
Zerfing Jess and Zerfing Elizabeth
Bought by
Zerfing Jess V and Zerfing Elizabeth A
Current Estimated Value
Home Financials for this Owner
Home Financials are based on the most recent Mortgage that was taken out on this home.
Original Mortgage
$185,185
Outstanding Balance
$155,747
Interest Rate
3.99%
Mortgage Type
FHA
Estimated Equity
$229,776
Purchase Details
Closed on
Jun 8, 2016
Sold by
Vacca Linda S
Bought by
Zerfing Elizabeth and Zerfing Jess
Home Financials for this Owner
Home Financials are based on the most recent Mortgage that was taken out on this home.
Original Mortgage
$147,184
Interest Rate
3.66%
Mortgage Type
FHA
Purchase Details
Closed on
Nov 19, 2012
Sold by
Vacca Linda S
Bought by
Linda S Vacca Revocable Living Trust and Vacca Linda S
Purchase Details
Closed on
Oct 1, 2009
Sold by
Ballard Cathy
Bought by
Vacca Linda S
Create a Home Valuation Report for This Property
The Home Valuation Report is an in-depth analysis detailing your home's value as well as a comparison with similar homes in the area
Purchase History
| Date | Buyer | Sale Price | Title Company |
|---|---|---|---|
| Zerfing Jess V | -- | Columbia Gorge Title | |
| Zerfing Elizabeth | $149,900 | Columbia Gorge Title | |
| Linda S Vacca Revocable Living Trust | -- | None Available | |
| Vacca Linda S | $187,500 | None Available |
Source: Public Records
Mortgage History
| Date | Status | Borrower | Loan Amount |
|---|---|---|---|
| Open | Zerfing Jess V | $185,185 | |
| Closed | Zerfing Elizabeth | $147,184 |
Source: Public Records
Tax History
| Year | Tax Paid | Tax Assessment Tax Assessment Total Assessment is a certain percentage of the fair market value that is determined by local assessors to be the total taxable value of land and additions on the property. | Land | Improvement |
|---|---|---|---|---|
| 2025 | $2,802 | $190,920 | $101,690 | $89,230 |
| 2024 | $2,680 | $185,360 | $98,740 | $86,620 |
| 2023 | $2,680 | $179,970 | $95,860 | $84,110 |
| 2022 | $2,459 | $174,730 | $53,210 | $121,520 |
| 2021 | $2,396 | $169,650 | $51,660 | $117,990 |
| 2020 | $2,302 | $164,710 | $50,160 | $114,550 |
| 2019 | $2,135 | $159,920 | $48,700 | $111,220 |
| 2018 | $2,152 | $155,270 | $47,280 | $107,990 |
| 2017 | $2,096 | $150,750 | $45,910 | $104,840 |
| 2016 | $1,966 | $146,360 | $44,570 | $101,790 |
| 2015 | $1,825 | $142,100 | $43,270 | $98,830 |
| 2014 | $1,989 | $137,970 | $42,010 | $95,960 |
| 2013 | $1,842 | $133,960 | $40,790 | $93,170 |
Source: Public Records
Map
Nearby Homes
- 14 NW Lakeside Dr
- 922 SW Spelling Place
- 725 SW Moody Ave
- 935 Spelling Place Unit 17
- 820 SE Frontage Rd
- 951 Spelling Place Unit 14
- 245 SW Sternwheeler Dr Unit 24
- 1153 Chinookan Dr
- 1172 Chinookan Dr
- 0 1st St Unit 551862197
- 541 NW Vancouver Ave
- 41 NW Lasher St Unit C4
- 438 NW Roselawn St
- 1090 SW Briggs St
- 79 NW Lasher St
- 403 NW Roselawn St
- 1225 SW Ryan Allen Rd
- 0 Frontage Rd
- 0 School St Unit 761845716
- 960 NW Angel Heights Rd
- 200 NE Riverview Dr
- 210 NE Riverview Dr
- 210 Riverview
- 205 NE Walnut St
- 135 Riverview
- 215 NW Walnut St
- 127 Riverview
- 201 NE Riverview Dr
- 220 NE Riverview Dr
- 115 NE Crest Dr
- 225 NE Walnut St
- 211 Riverview
- 219 Riverview Dr
- 119 NE Riverview Dr
- 228 Riverview
- 105 NE Crest Dr
- 210 NW Walnut St
- 110 NE Riverview Dr
- 220 NW Walnut St
- 200 NW Walnut St
Your Personal Tour Guide
Ask me questions while you tour the home.